Changelog
Follow up on the latest improvements and updates.
RSS
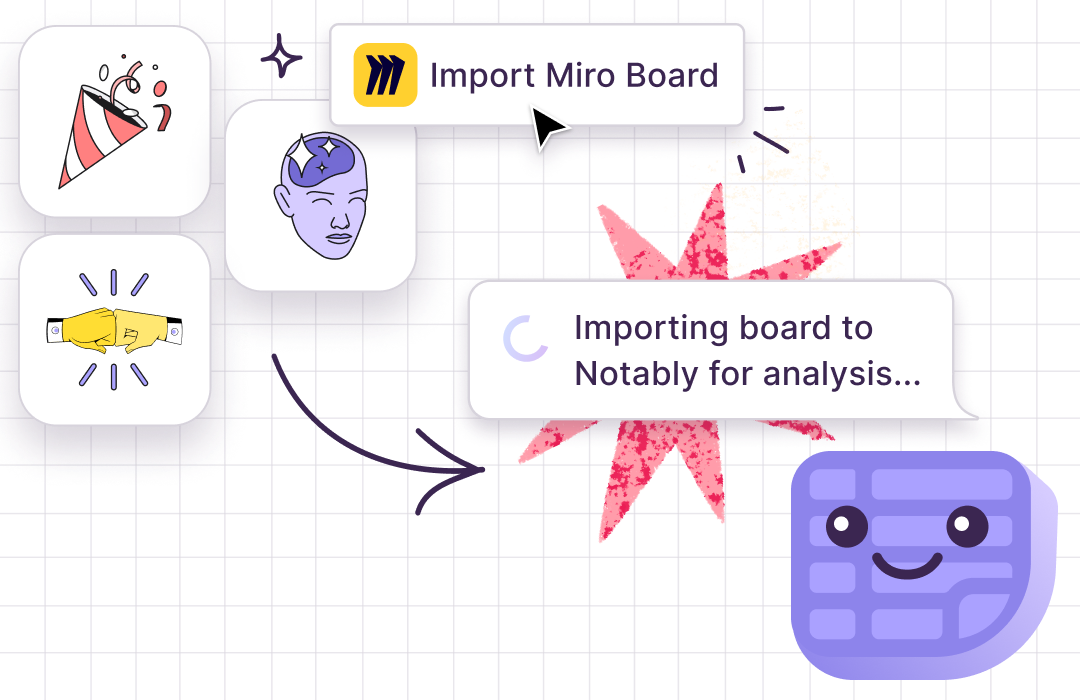
Many of our customers rely on Miro today for it’s unmatched real-time collaboration experience. This is true whether they are design teams brainstorming early concepts or agencies conducting workshops with clients.
But while Miro is an incredible place to work together, it’s challenging to step back from the Board to identify trends. Additionally, it's not a long-term home for research data and insight to live.
Now it doesn't have to. You can use Notably and Miro together seamlessly.
How the Notably + Miro Integration Works
- Use Miro for notes, workshops, or brainstorming sessions.
- In Notably, under ‘Analysis,’ select ‘Import Miro Board’ in a new or existing project.
- Choose a Miro board to import into Notably.
- Now your Miro data is themed, tagged, searchable & can be analyzed with Notably's AI features.
We have exciting plans in store to deepen the experience working with Miro, plus integrations with other whiteboarding tools you know and love.
Dive deeper into these 3 tips for getting the most out of Notably + Miro on the blog.
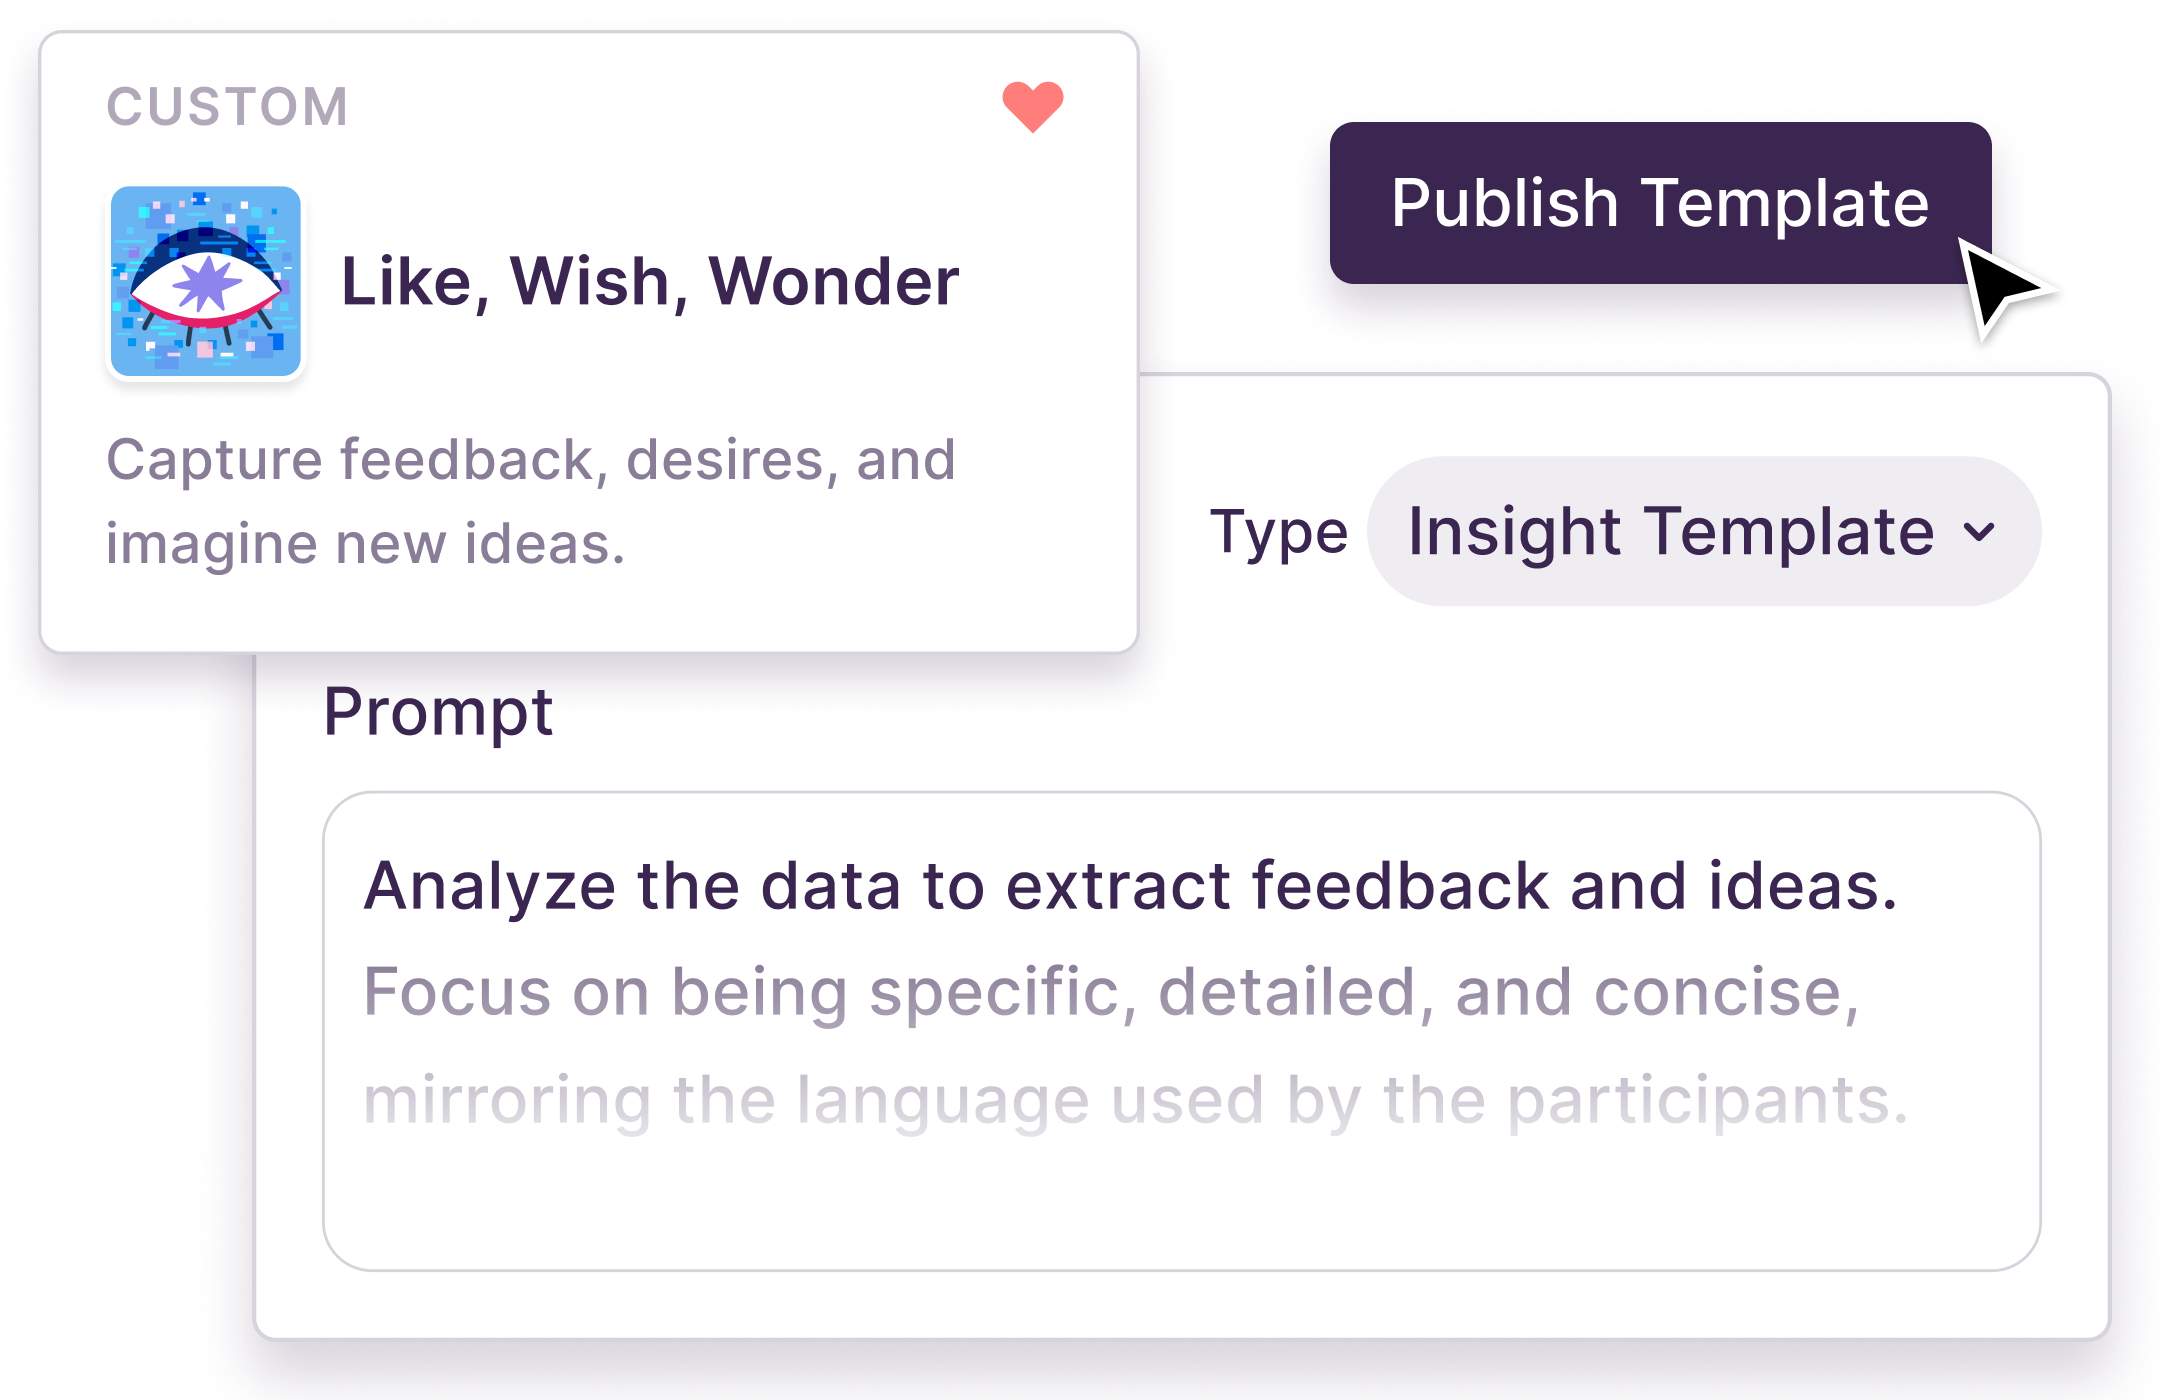
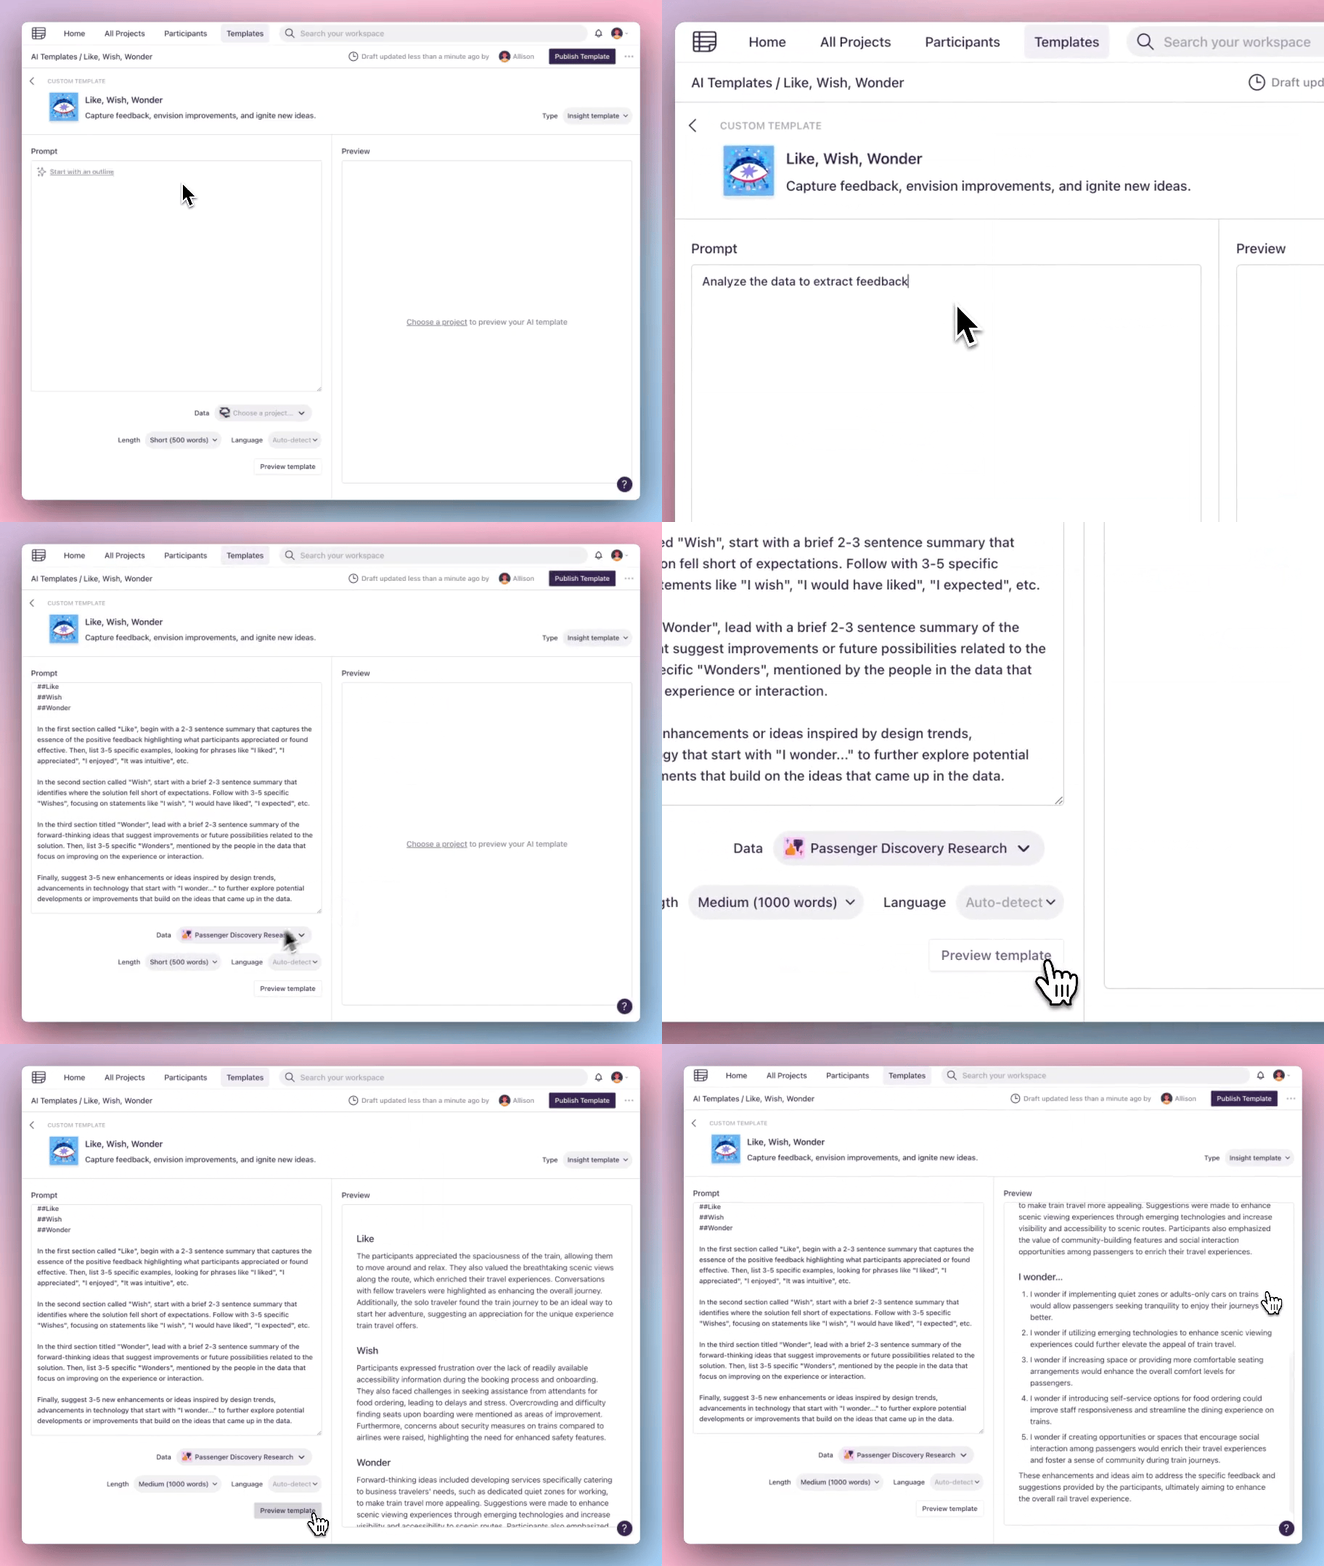
Create a template inspired by your company's values or personas, your favorite research framework, a fun workshop activity– anything you can imagine. Write your prompt from scratch or click “start from outline” for help getting started. Use our Library of AI Templates to inspire your own.
Test your template on several different data sources in order to fine tune the prompt, and publish it for instant access to use on research in your workspace.
If you're on
Pro
, you can still use this Templates playground to ask anything of your data and preview the output. Upgrade to Teams for the ability to publish these templates for use on your research in Notably. If you have any questions, join us for our next live group demo.
What new AI Template will you create today?!
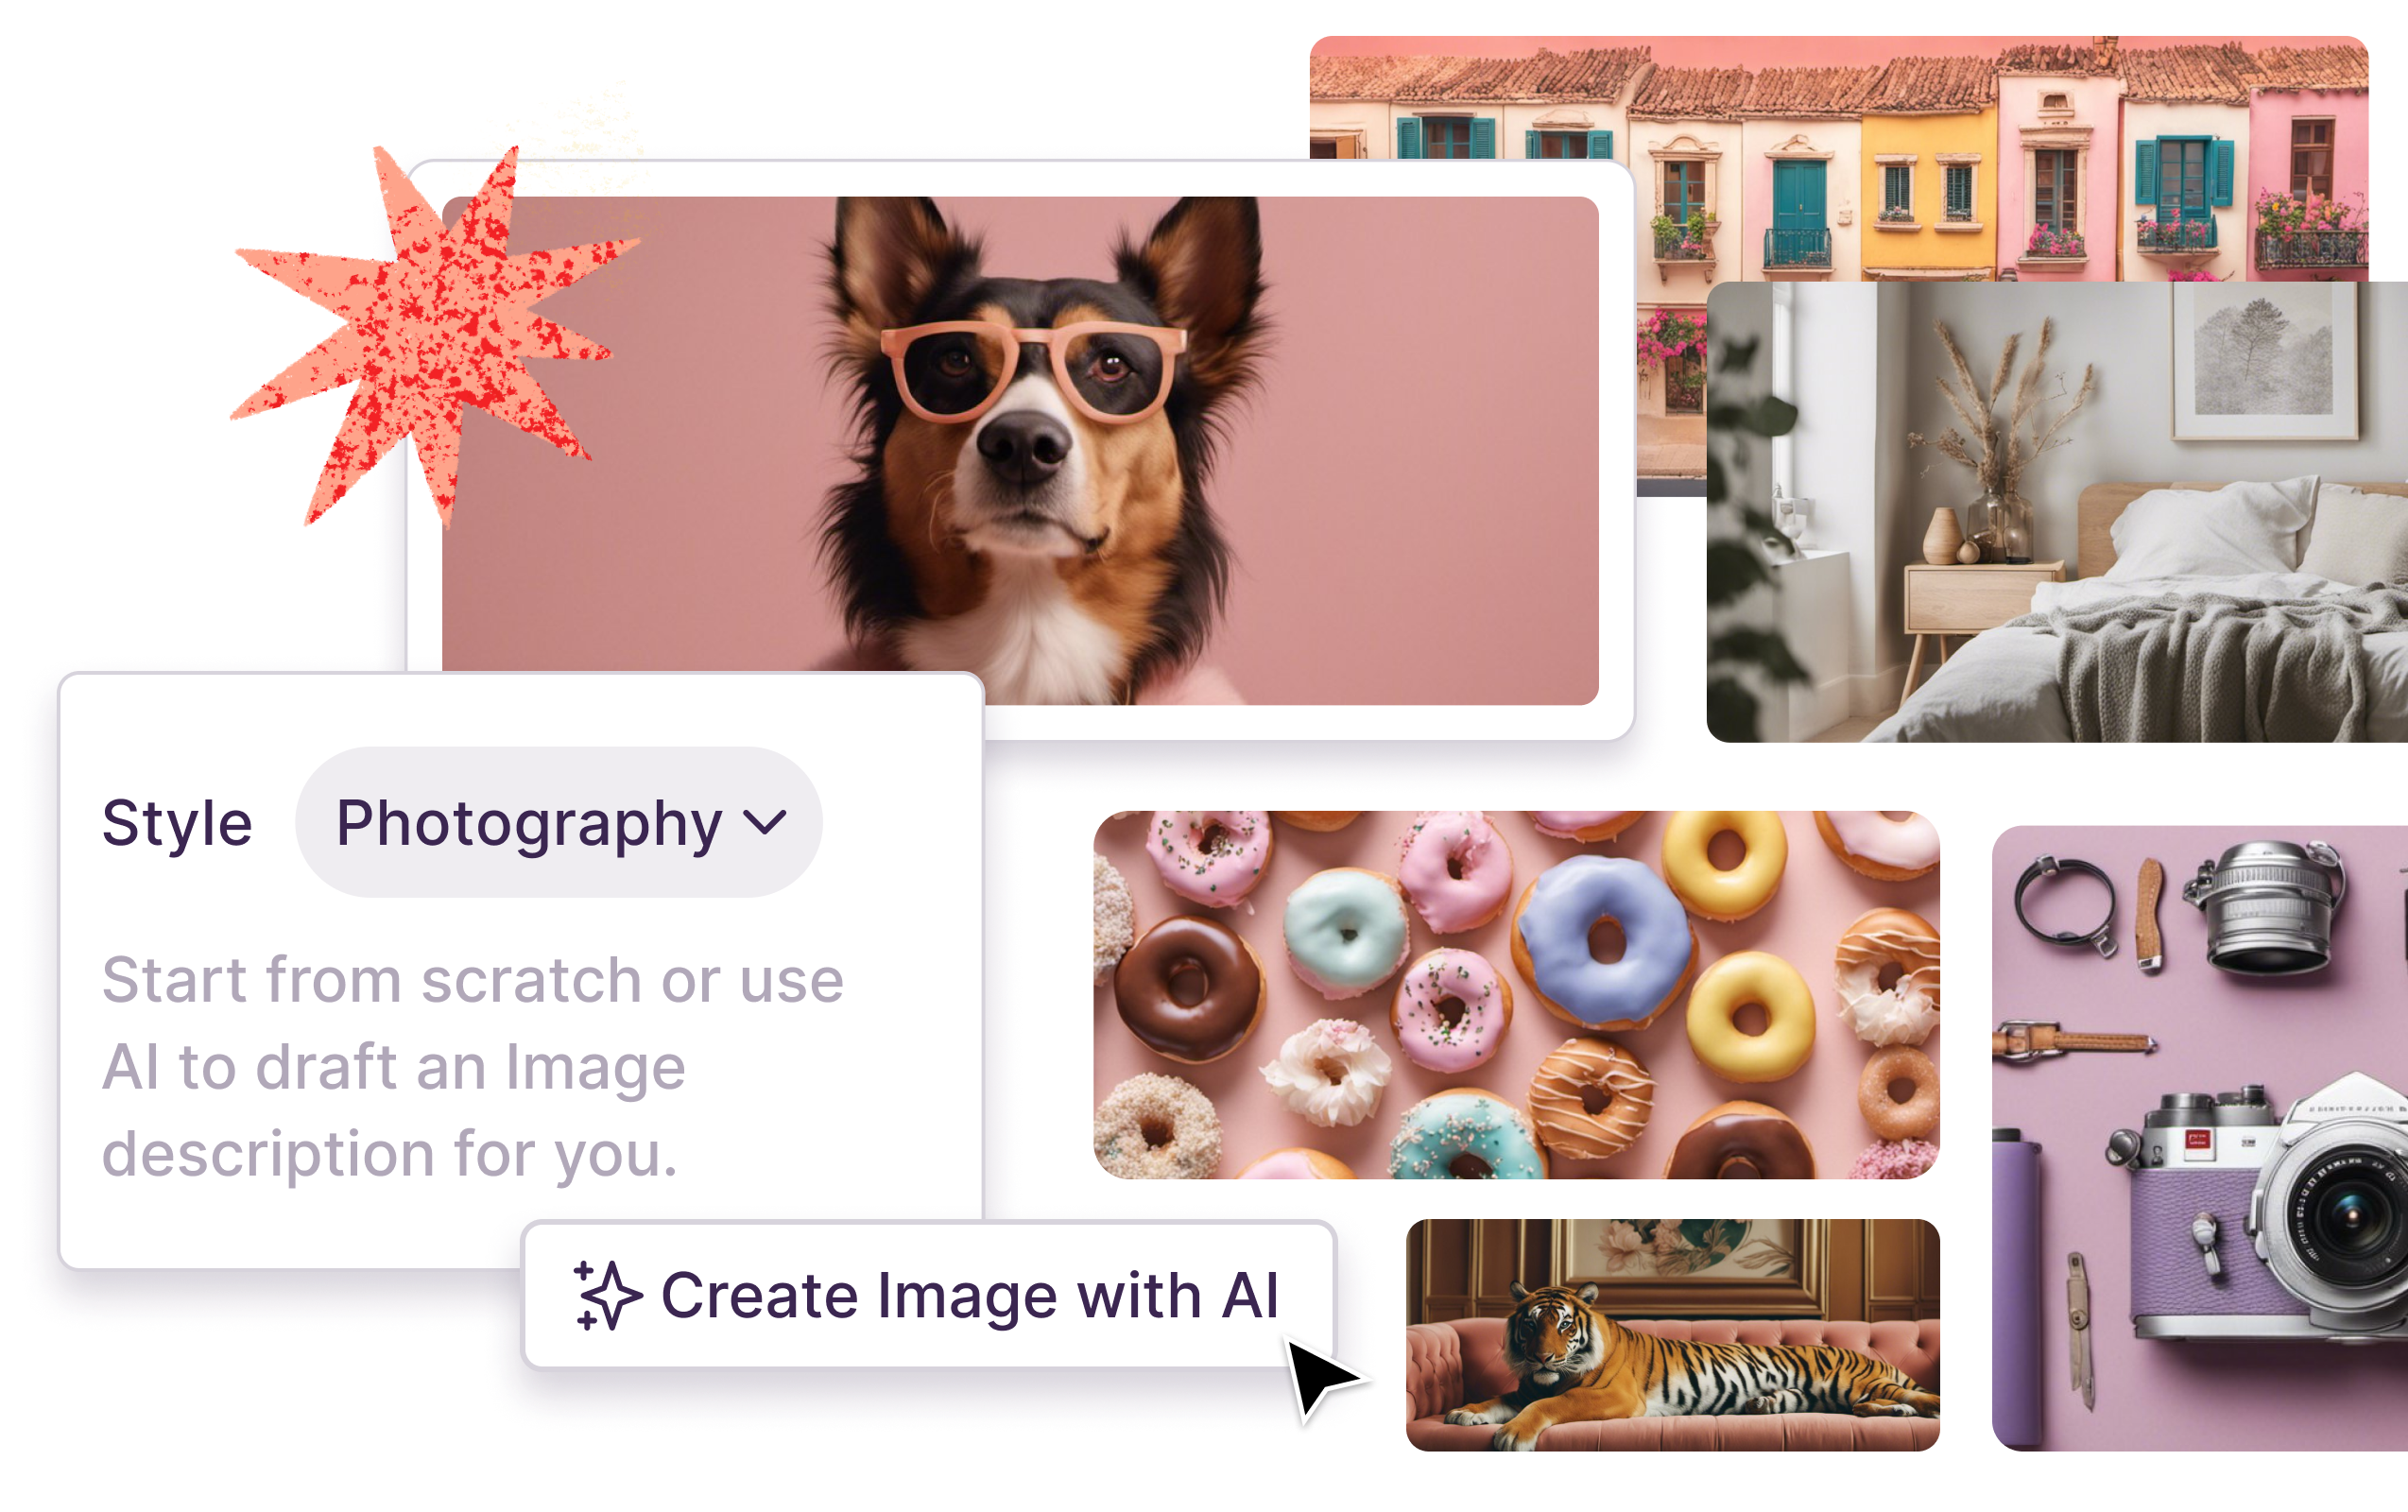
Now you can create one-of-a-kind images for your insights using AI in Notably. Either start from scratch with a description of your vision or draft up a description with AI based on the content of your Insight.
How to create images with AI
- At the top of an Insight, click “Create Image with AI.”
- Choose a style and describe your vision (or use AI to draft it for you from your Insight content)
- Click “Create Images” to generate 4 options.
- Choose the image you like, then click “Use Image.”
For inspiration and as a cheat sheet, here's a link to a collection of insights with images created in Notably and the descriptions used to create them. (We'll keep adding to this, so make sure to bookmark it.)
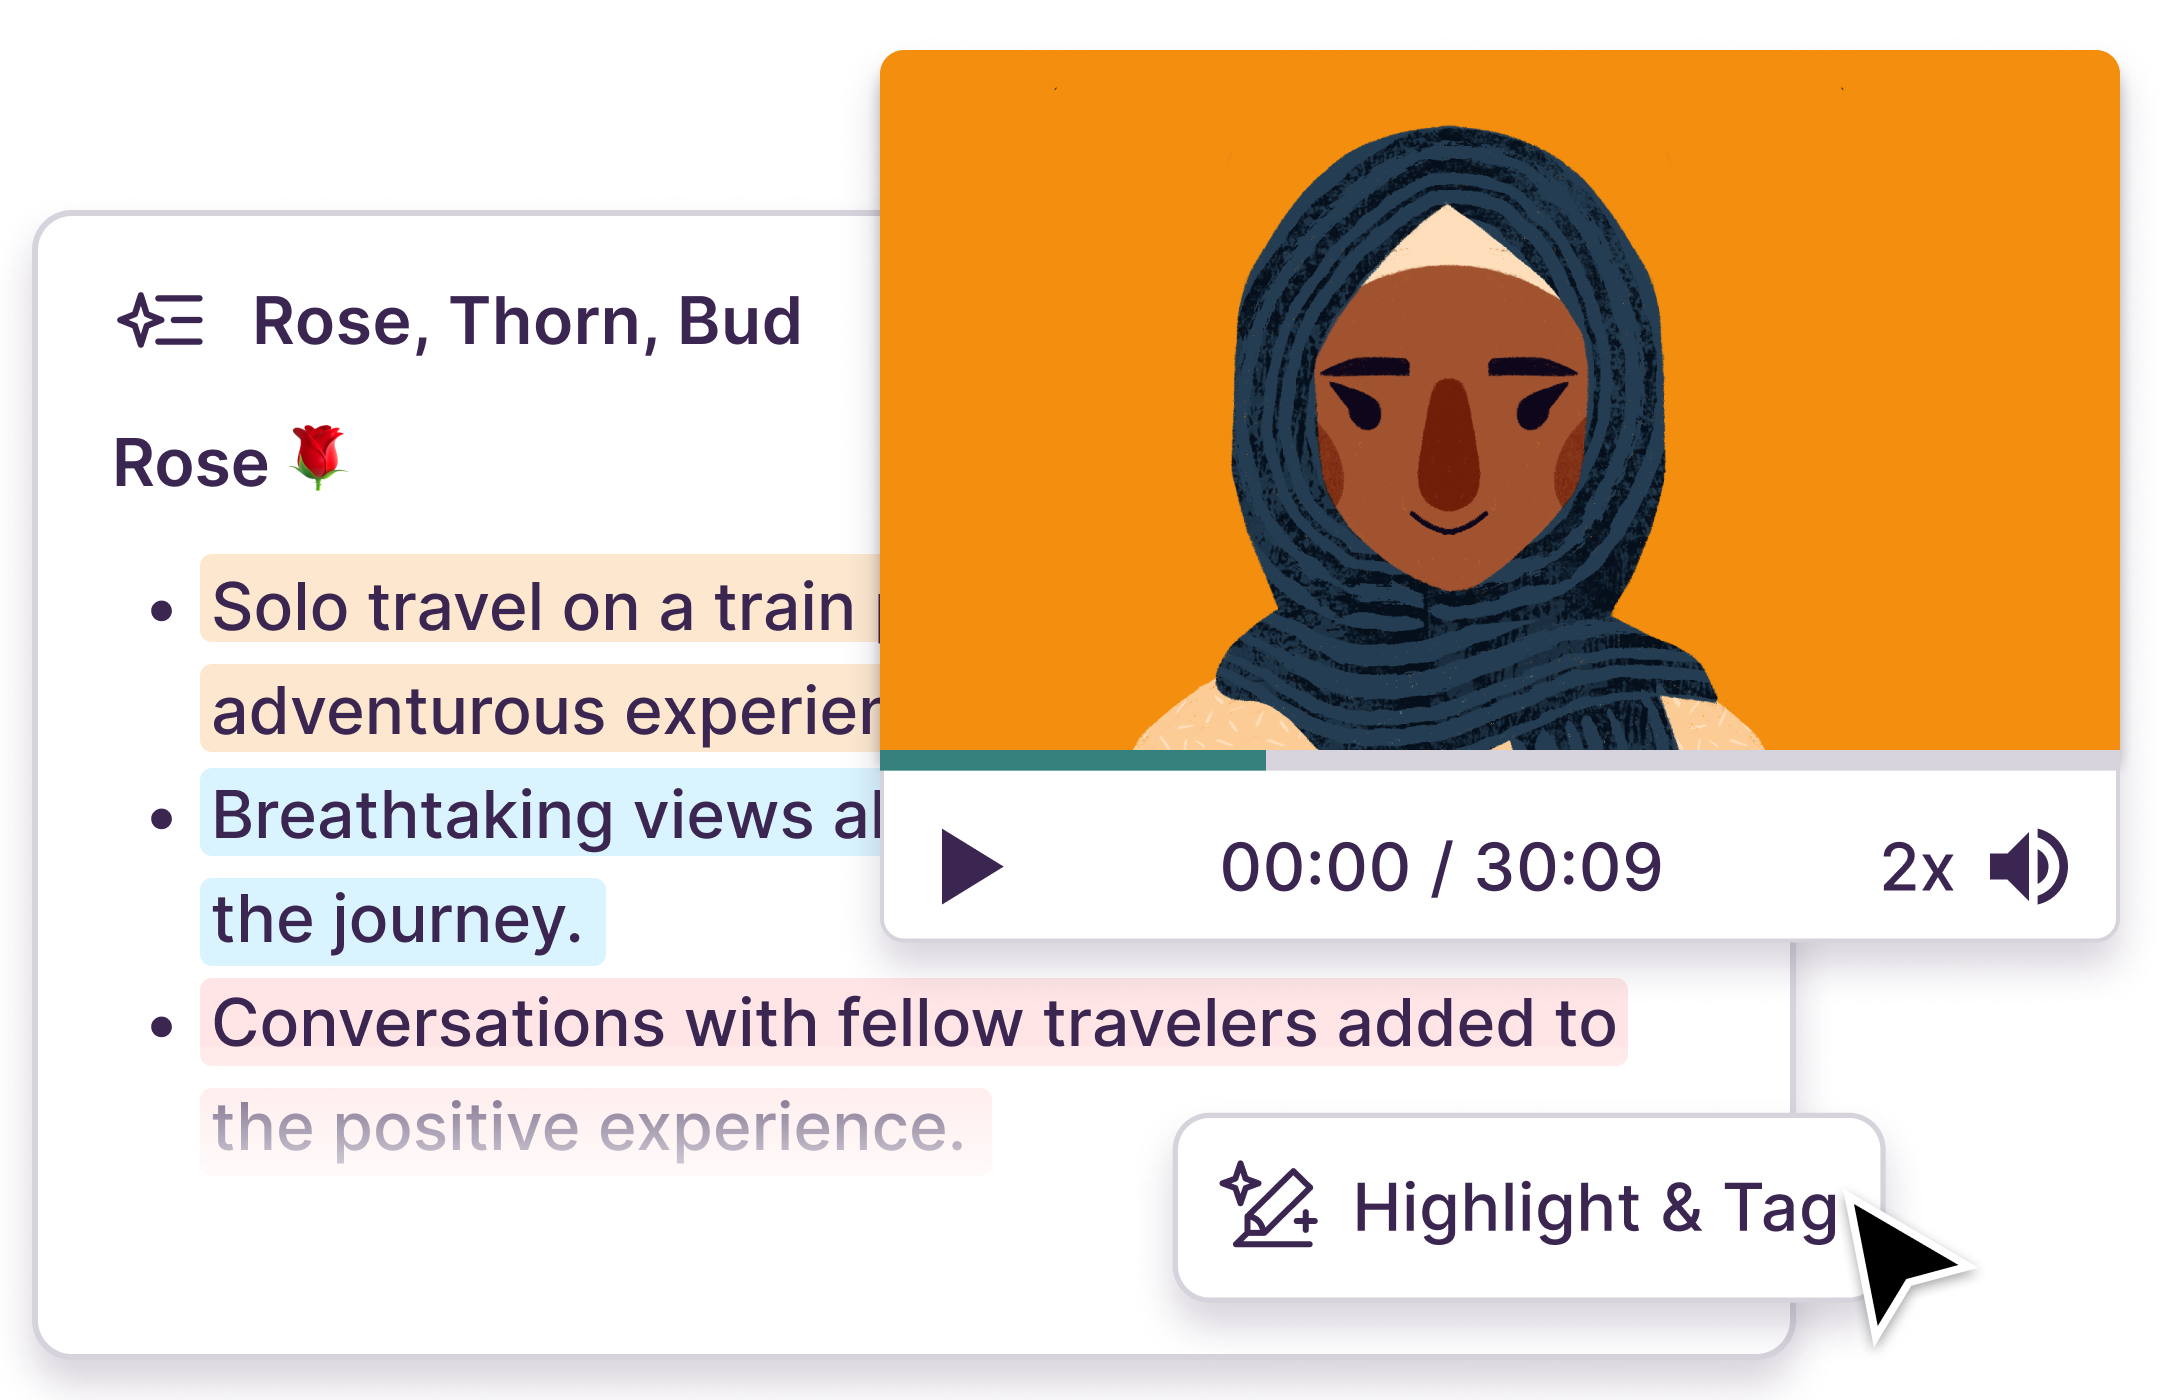
Automatically highlight and tag AI-generated Summaries on data files, reducing the friction to generate Insights in Notably almost entirely.
What used to take days or weeks to process interviews or notes, now can happen in a matter of minutes, going from raw data files, to structured patterns, to generating insights.
Improved Suggested Tags
As a bonus for this release, we've improved our suggested tags algorithm. Now, the keywords added to your tag descriptions have more influence. And as a double bonus, we've written a prompt you can use with ChatGPT to generate keywords to enrich your custom tags at the bottom of this post.
How to use automatic highlights and tagging in Notably
- Add data to a Notably project, such as videos or docs.
- Click “Summarize” and choose from one of our dozens of AI Summary Templates.
- At the bottom of the Summary block, click “Highlight & Tag”
- Watch the magic happen
For more information on how to use this feature and tips for enhancing the accuracy of tags, read this help article.


Spend more time with customers or generating new ideas and less time debriefing conversations in chat with Notably’s new Slack integration.
With the Slack integration enabled, you can import your recordings or dump your notes into a document & we’ll take care of the rest. Notably will automatically summarize the raw data using one of our AI Summary Templates and send it to Slack as soon as the summary is processed. It's like having your very own personal research assistant.
Soon you'll be able to send Insights to Slack, too.
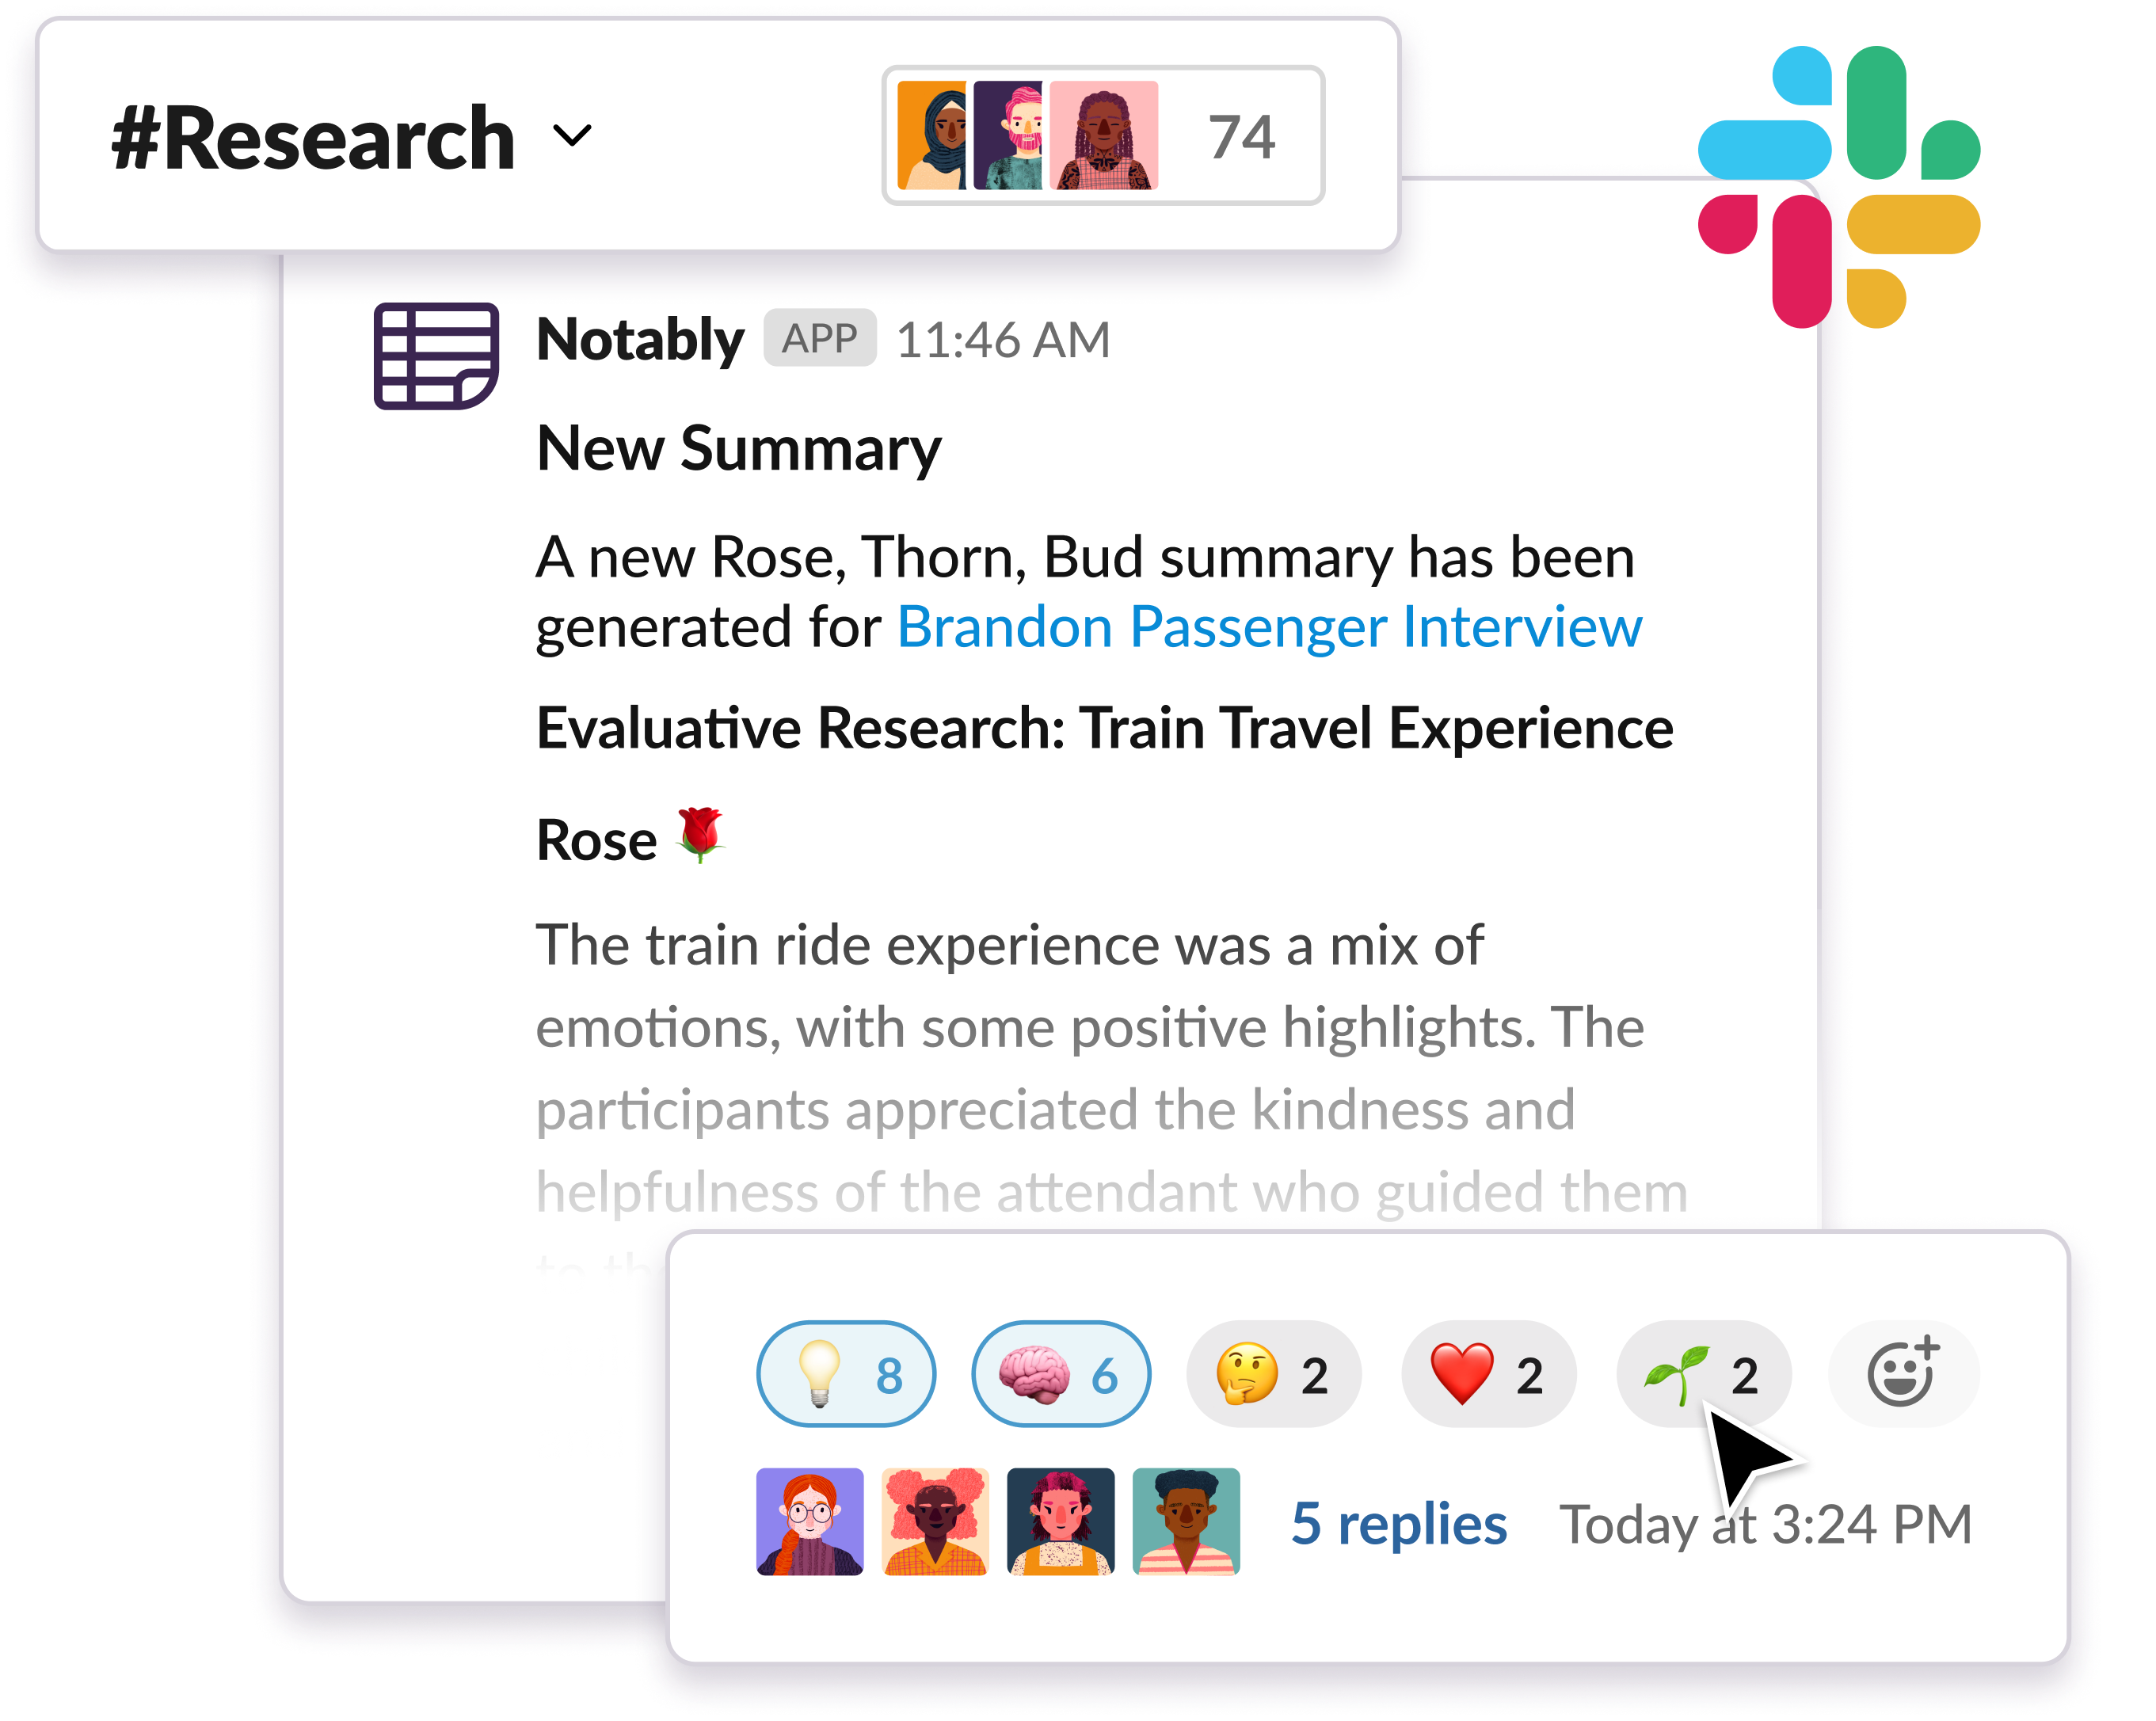
Here's how to activate the magic:
- Go to Integrations in your workspace settings.
- Click "Connect" to authorize Notably to access your Slack workspace.
- Choose your Slack channel for instant AI summaries.
And that's it! Sit back and watch the reactions and comments flow in.
Check out these 15 brand new AI Templates in categories across Customer Experience, Design & Research, Business, Education and more.
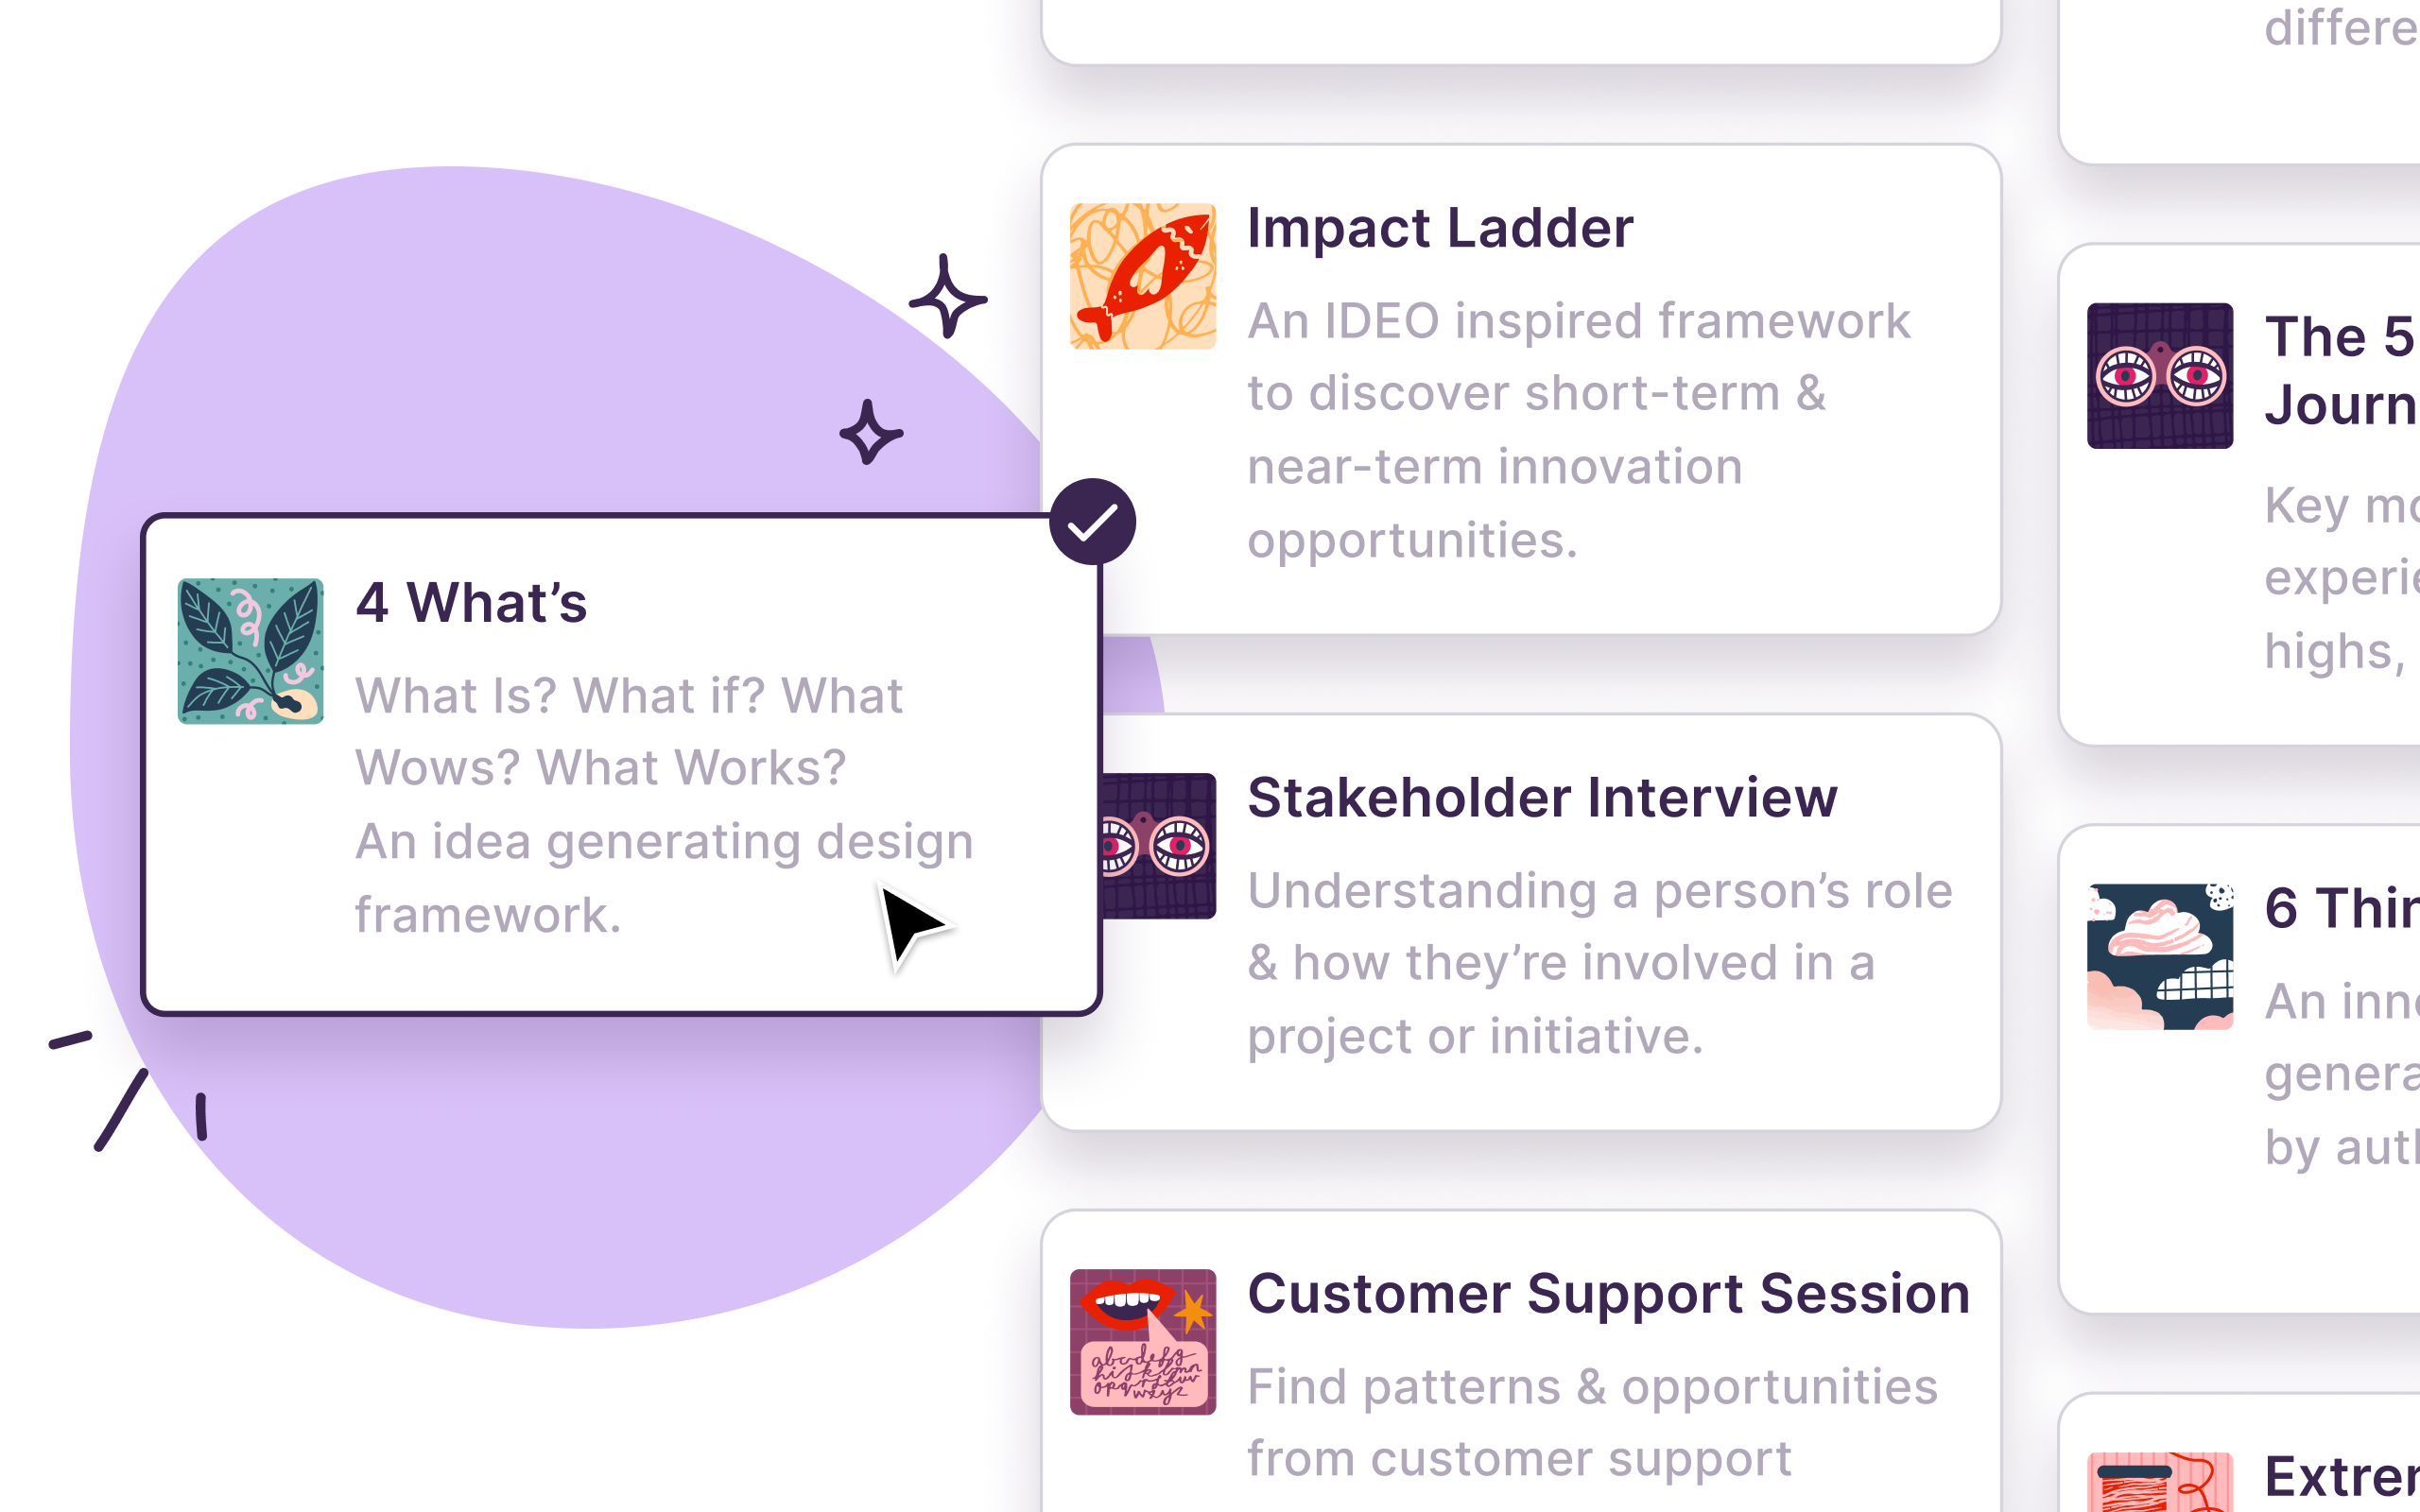
AI Summary Templates
With Summary Templates you can instantly generate summaries from a video with AI in Notably. Think of Summary Templates as your super-capable research assistant.
AI Insight Templates
With Insight Templates you can instantly generate insights from tagged and themed data with AI in Notably. Think of Insight Templates as the ultimate synthesis partner. It’s the best way to overcome creative block.
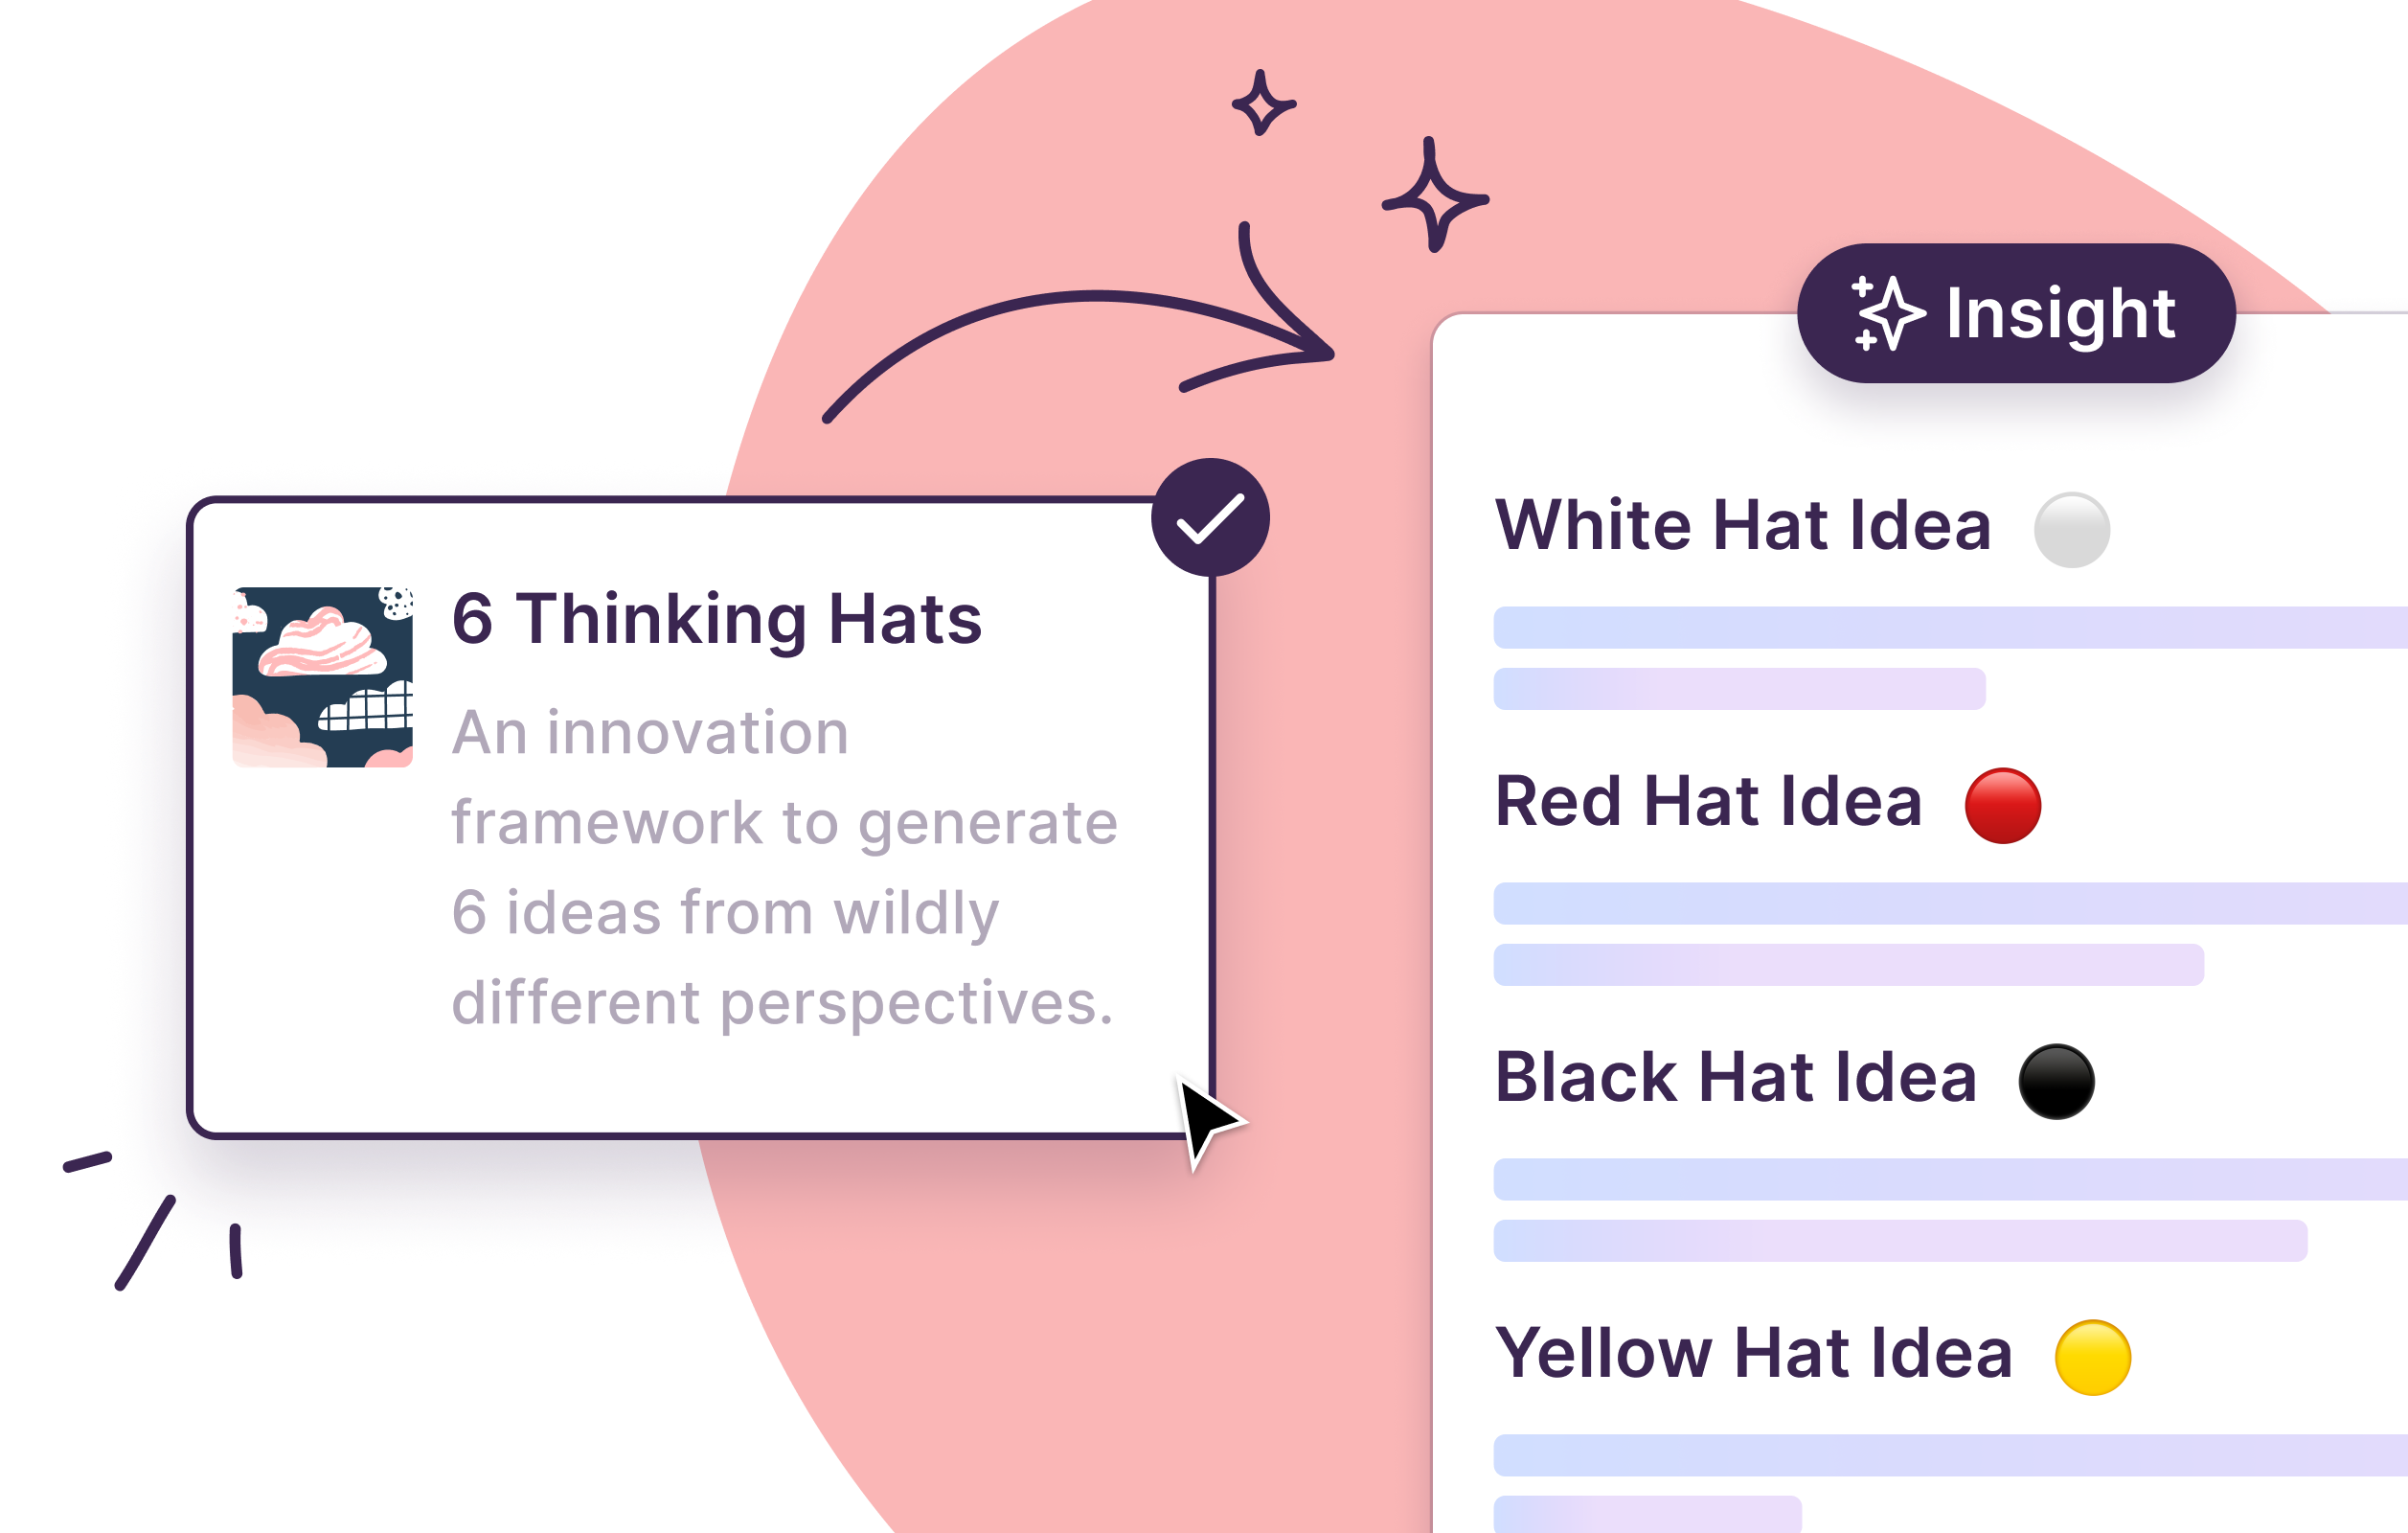
Start using Notably AI templates to inspire design thinking, leverage customer feedback, and more.
Speed and storytelling play a big part in a researcher's job, and we’re here to help with that blank document staring back at you.
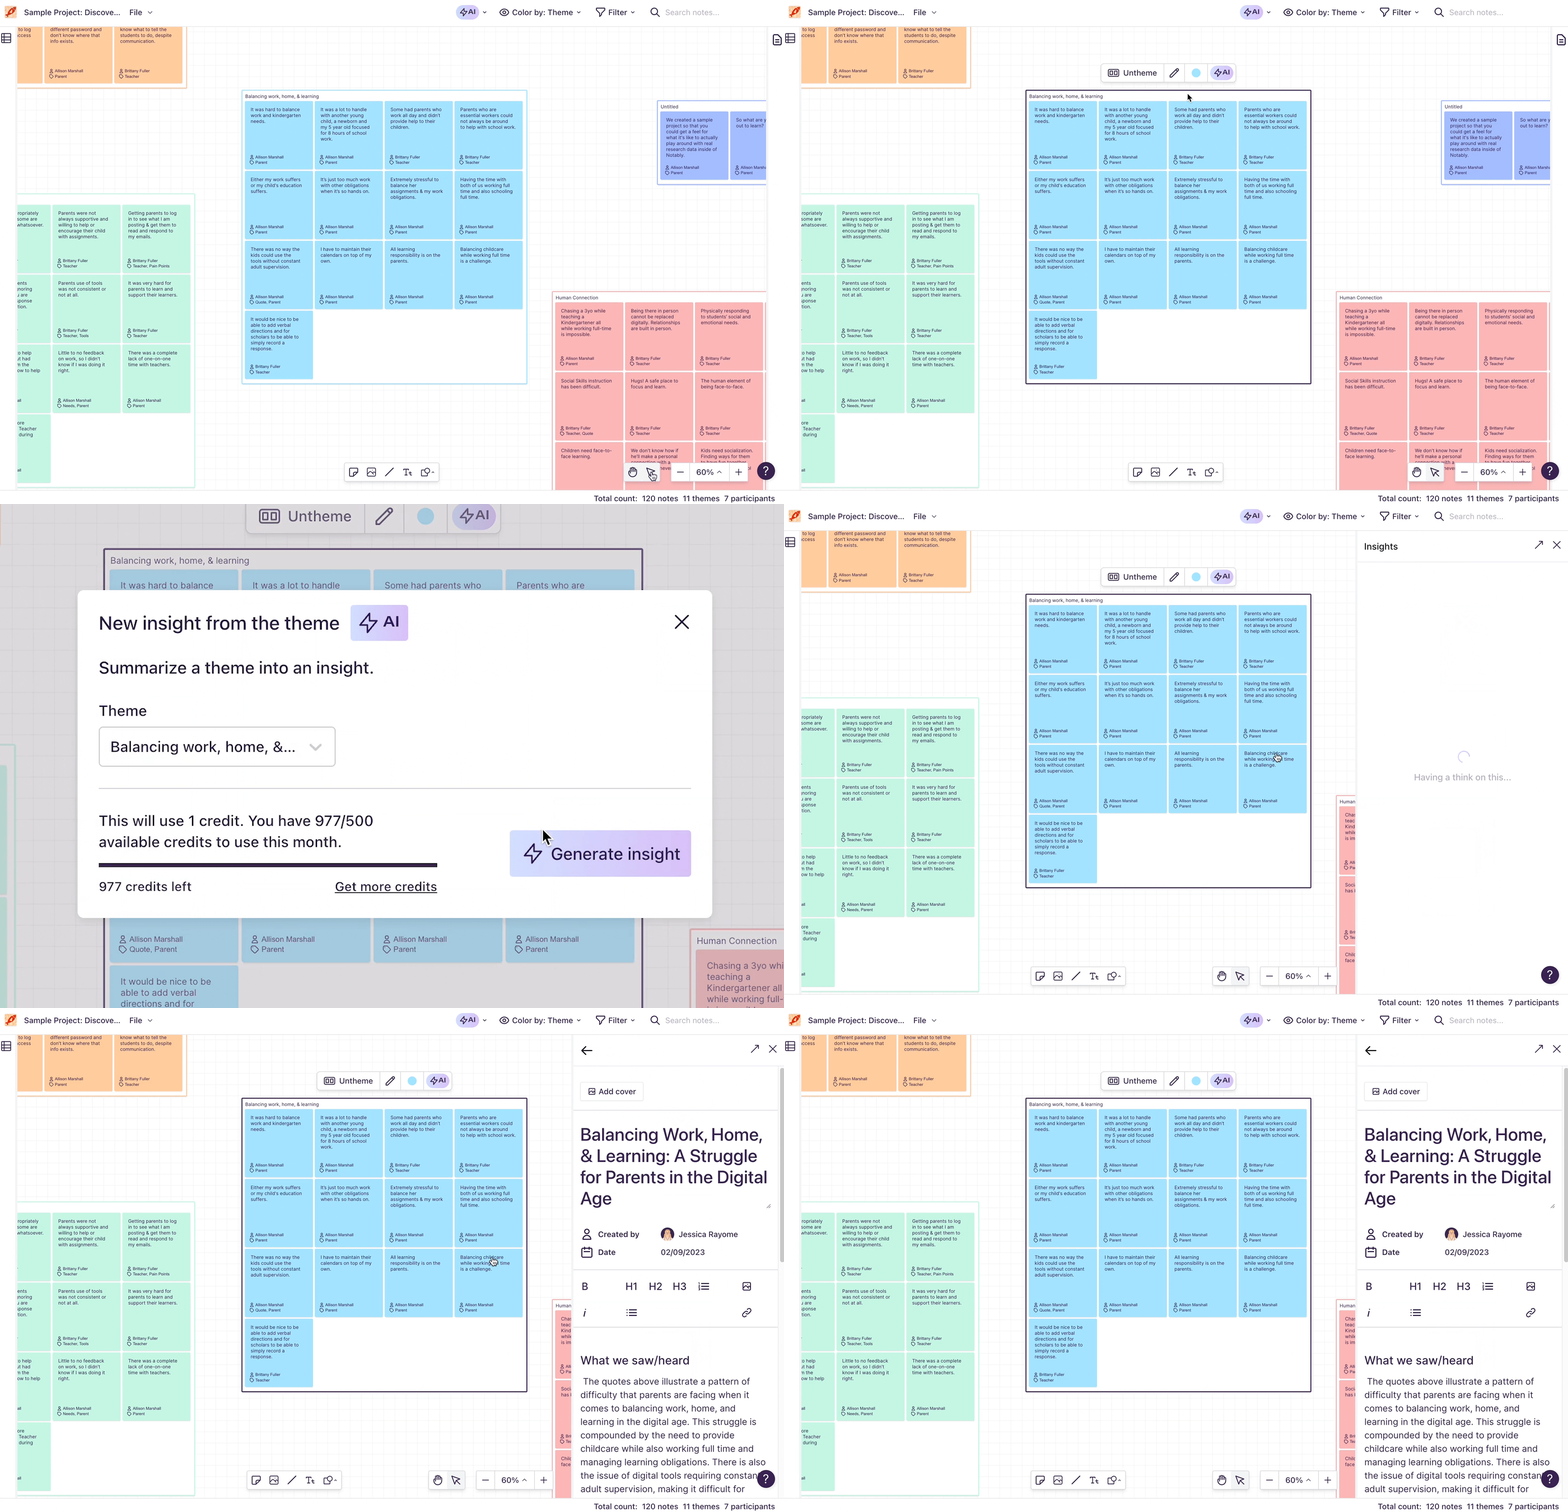
After clustering a project's data into themes, click on the AI button in the toolbar or on a specific theme to generate a new insight. From there you can use AI to suggest an insight statement and a structured narrative around that theme... in seconds.
Whether this unblocks your creativity, reveals errors or bias, or provides a perspective you might have missed, we hope this new feature becomes the research collaborator you can't work without.
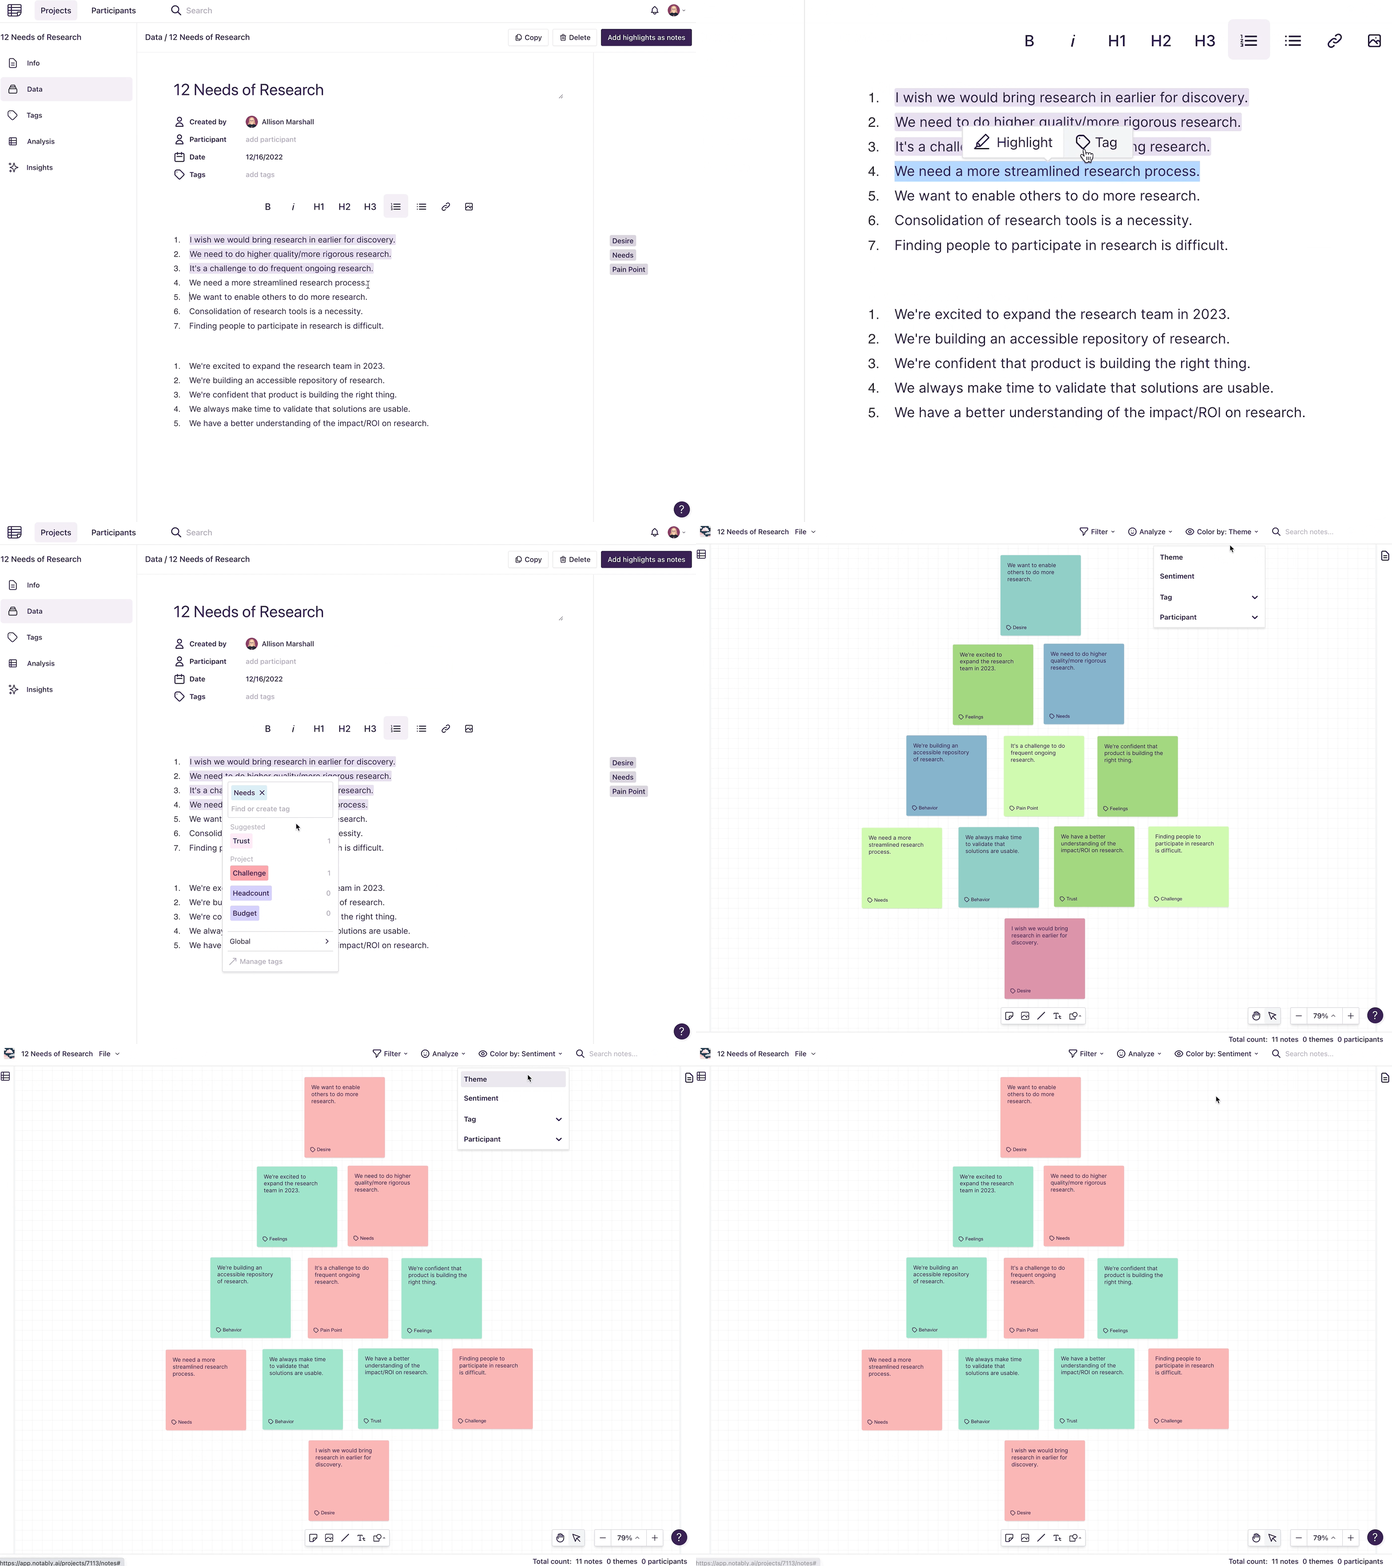
As you tag data, like transcripts or notes, we suggest tags at the top of your tags list.
The suggestions are based on the keywords added in your tags taxonomy and the content you've previously highlighted and tagged. The more you tag, the better suggestions will be. The more keywords used to define your tags, the better suggestions will be.
Happy tagging!
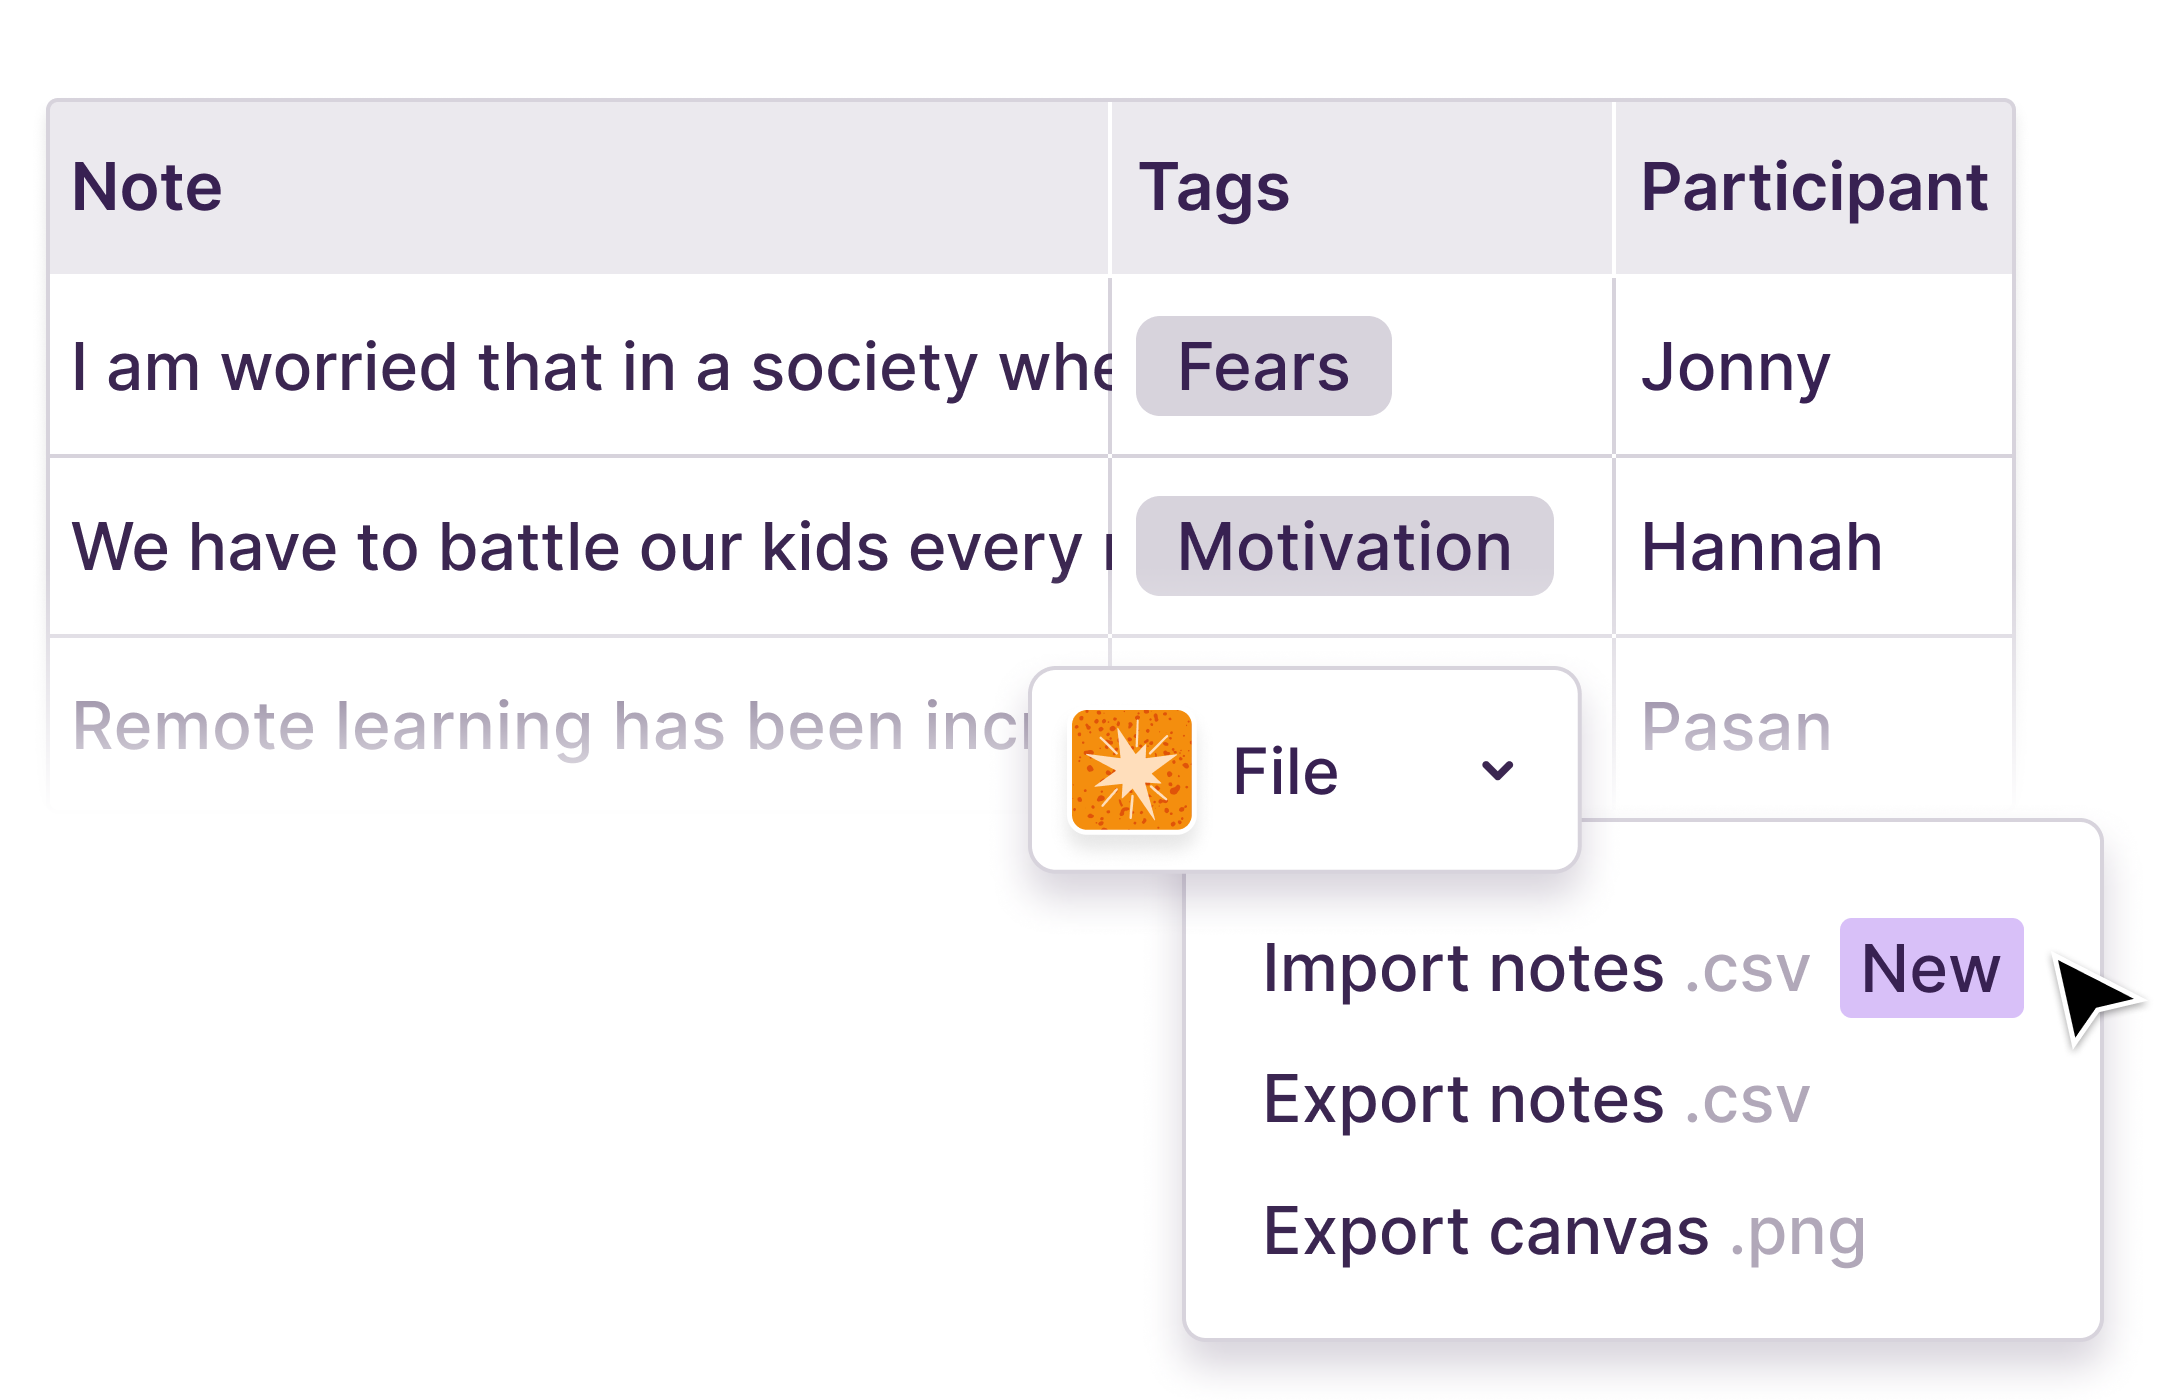
You can import a .csv file in the Analysis section of any Notably project. With just a couple clicks, you can populate your participant database and generate hundreds of notes that are tagged and ready for analysis.
As long as there's a column titled "Notes", "Tags", and "Participant" we'll do the rest of the heavy lifting.
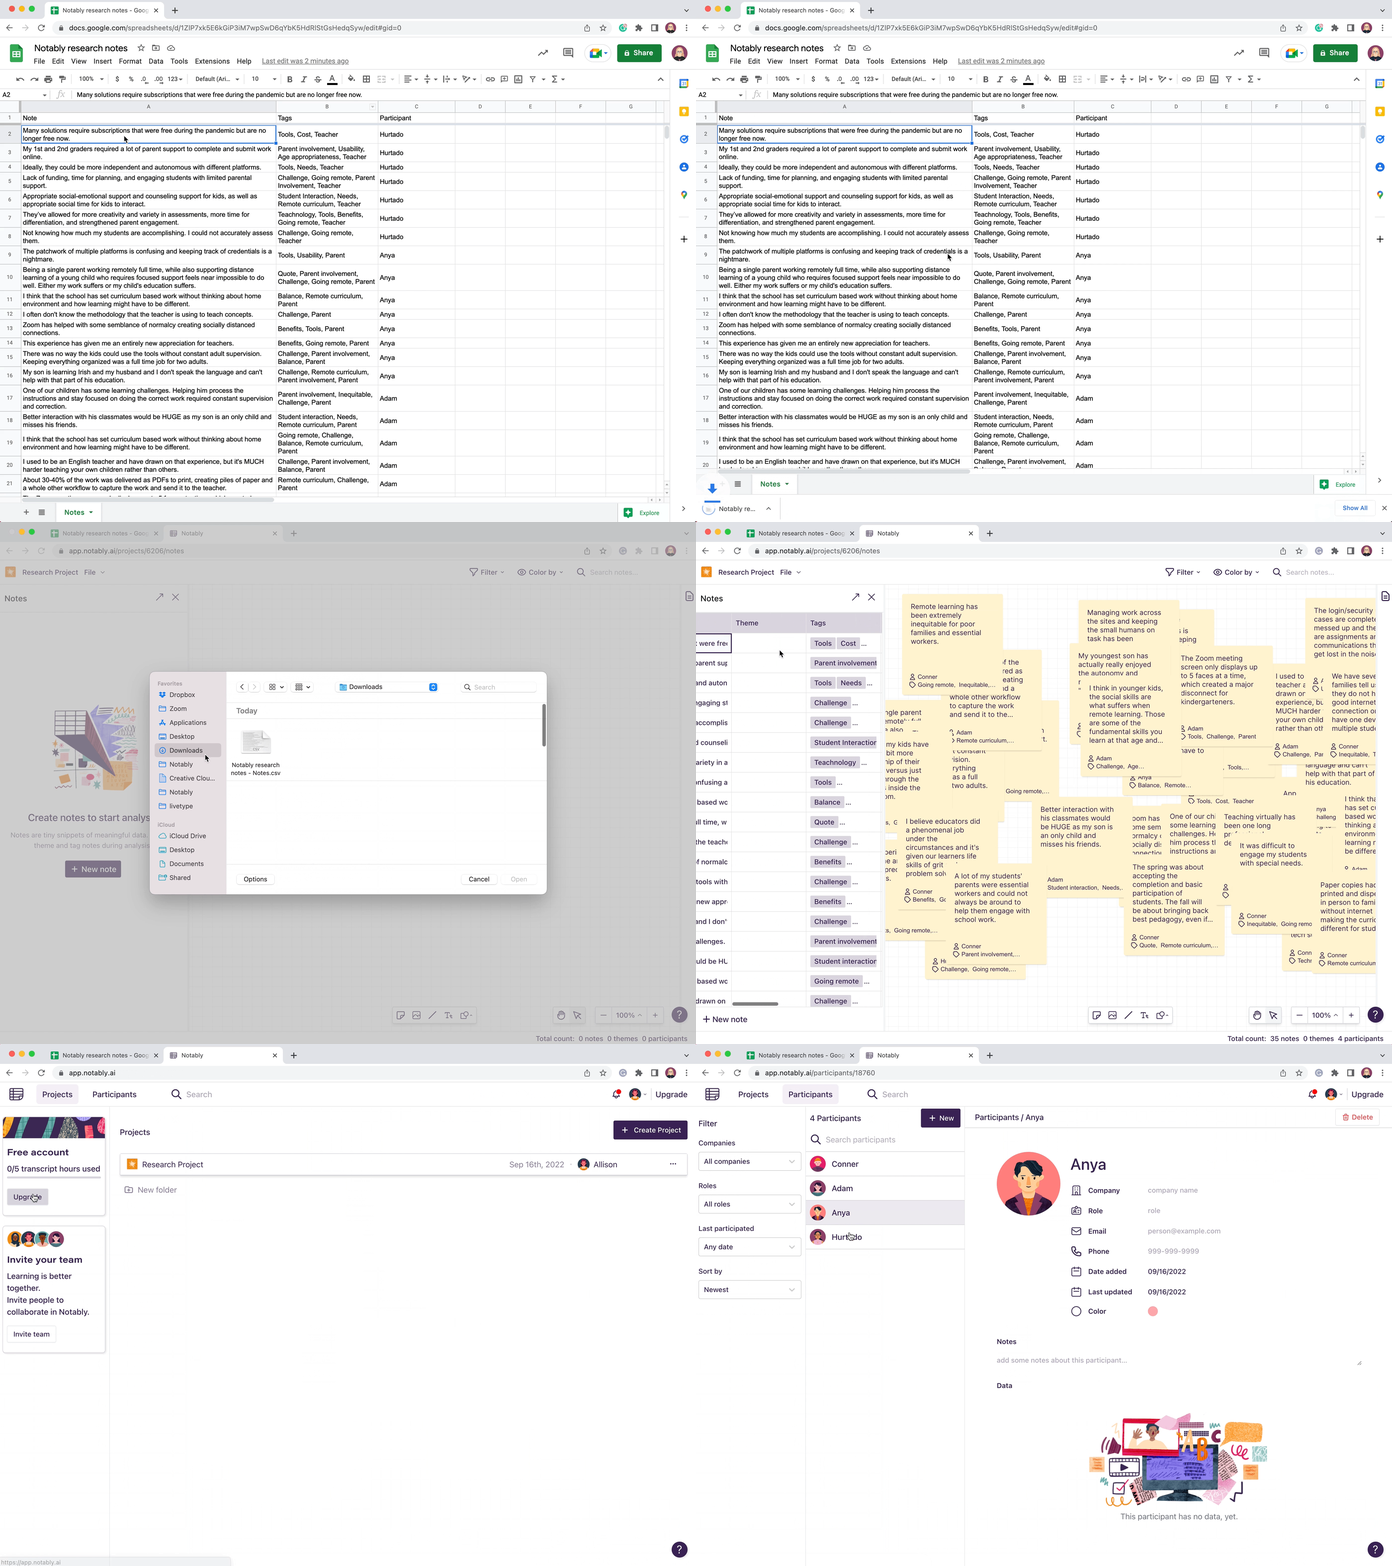
Feel free to try it yourself by downloading this spreadsheet or read the FAQ article for more on importing and exporting data inside a Notably project.
Participant Management isn’t
just
a dedicated place to track and recruit people from your audience. It plays an important part in analysis, too.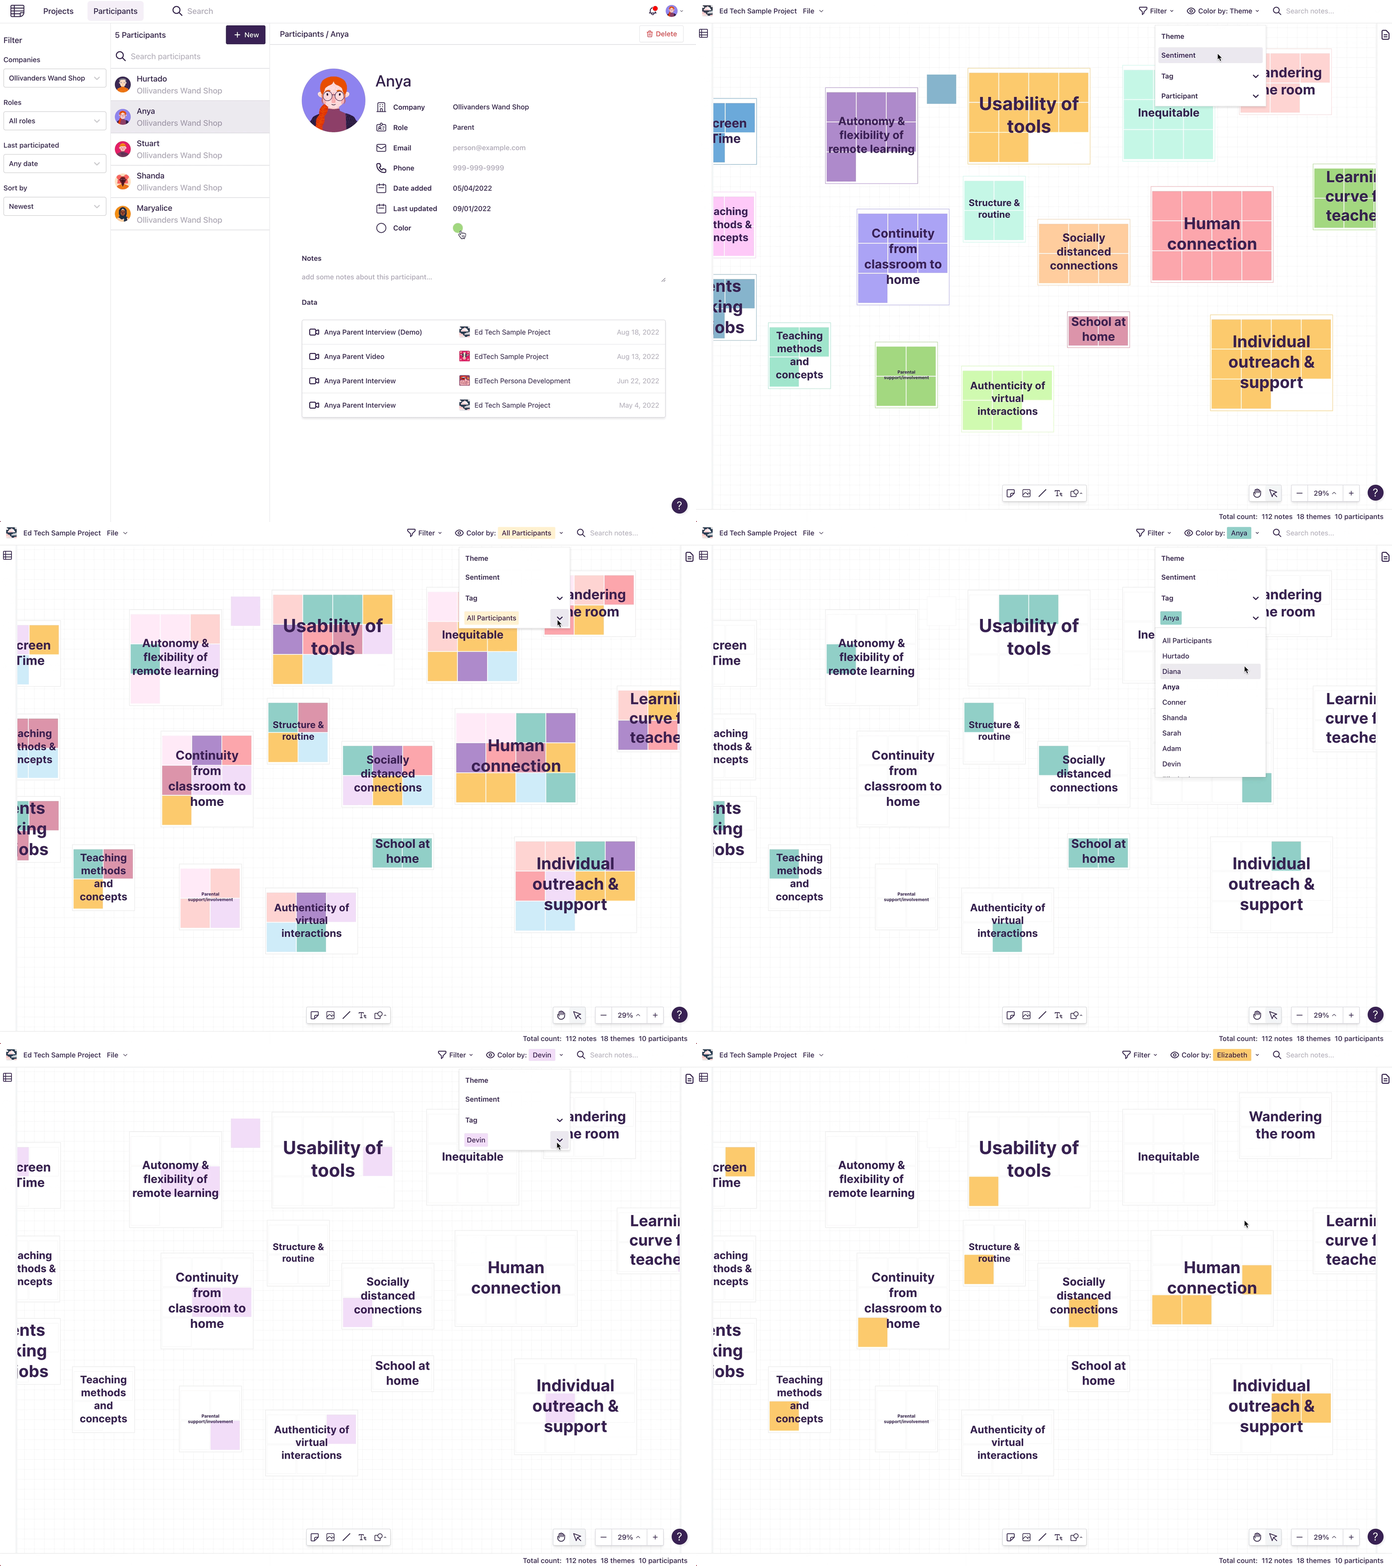
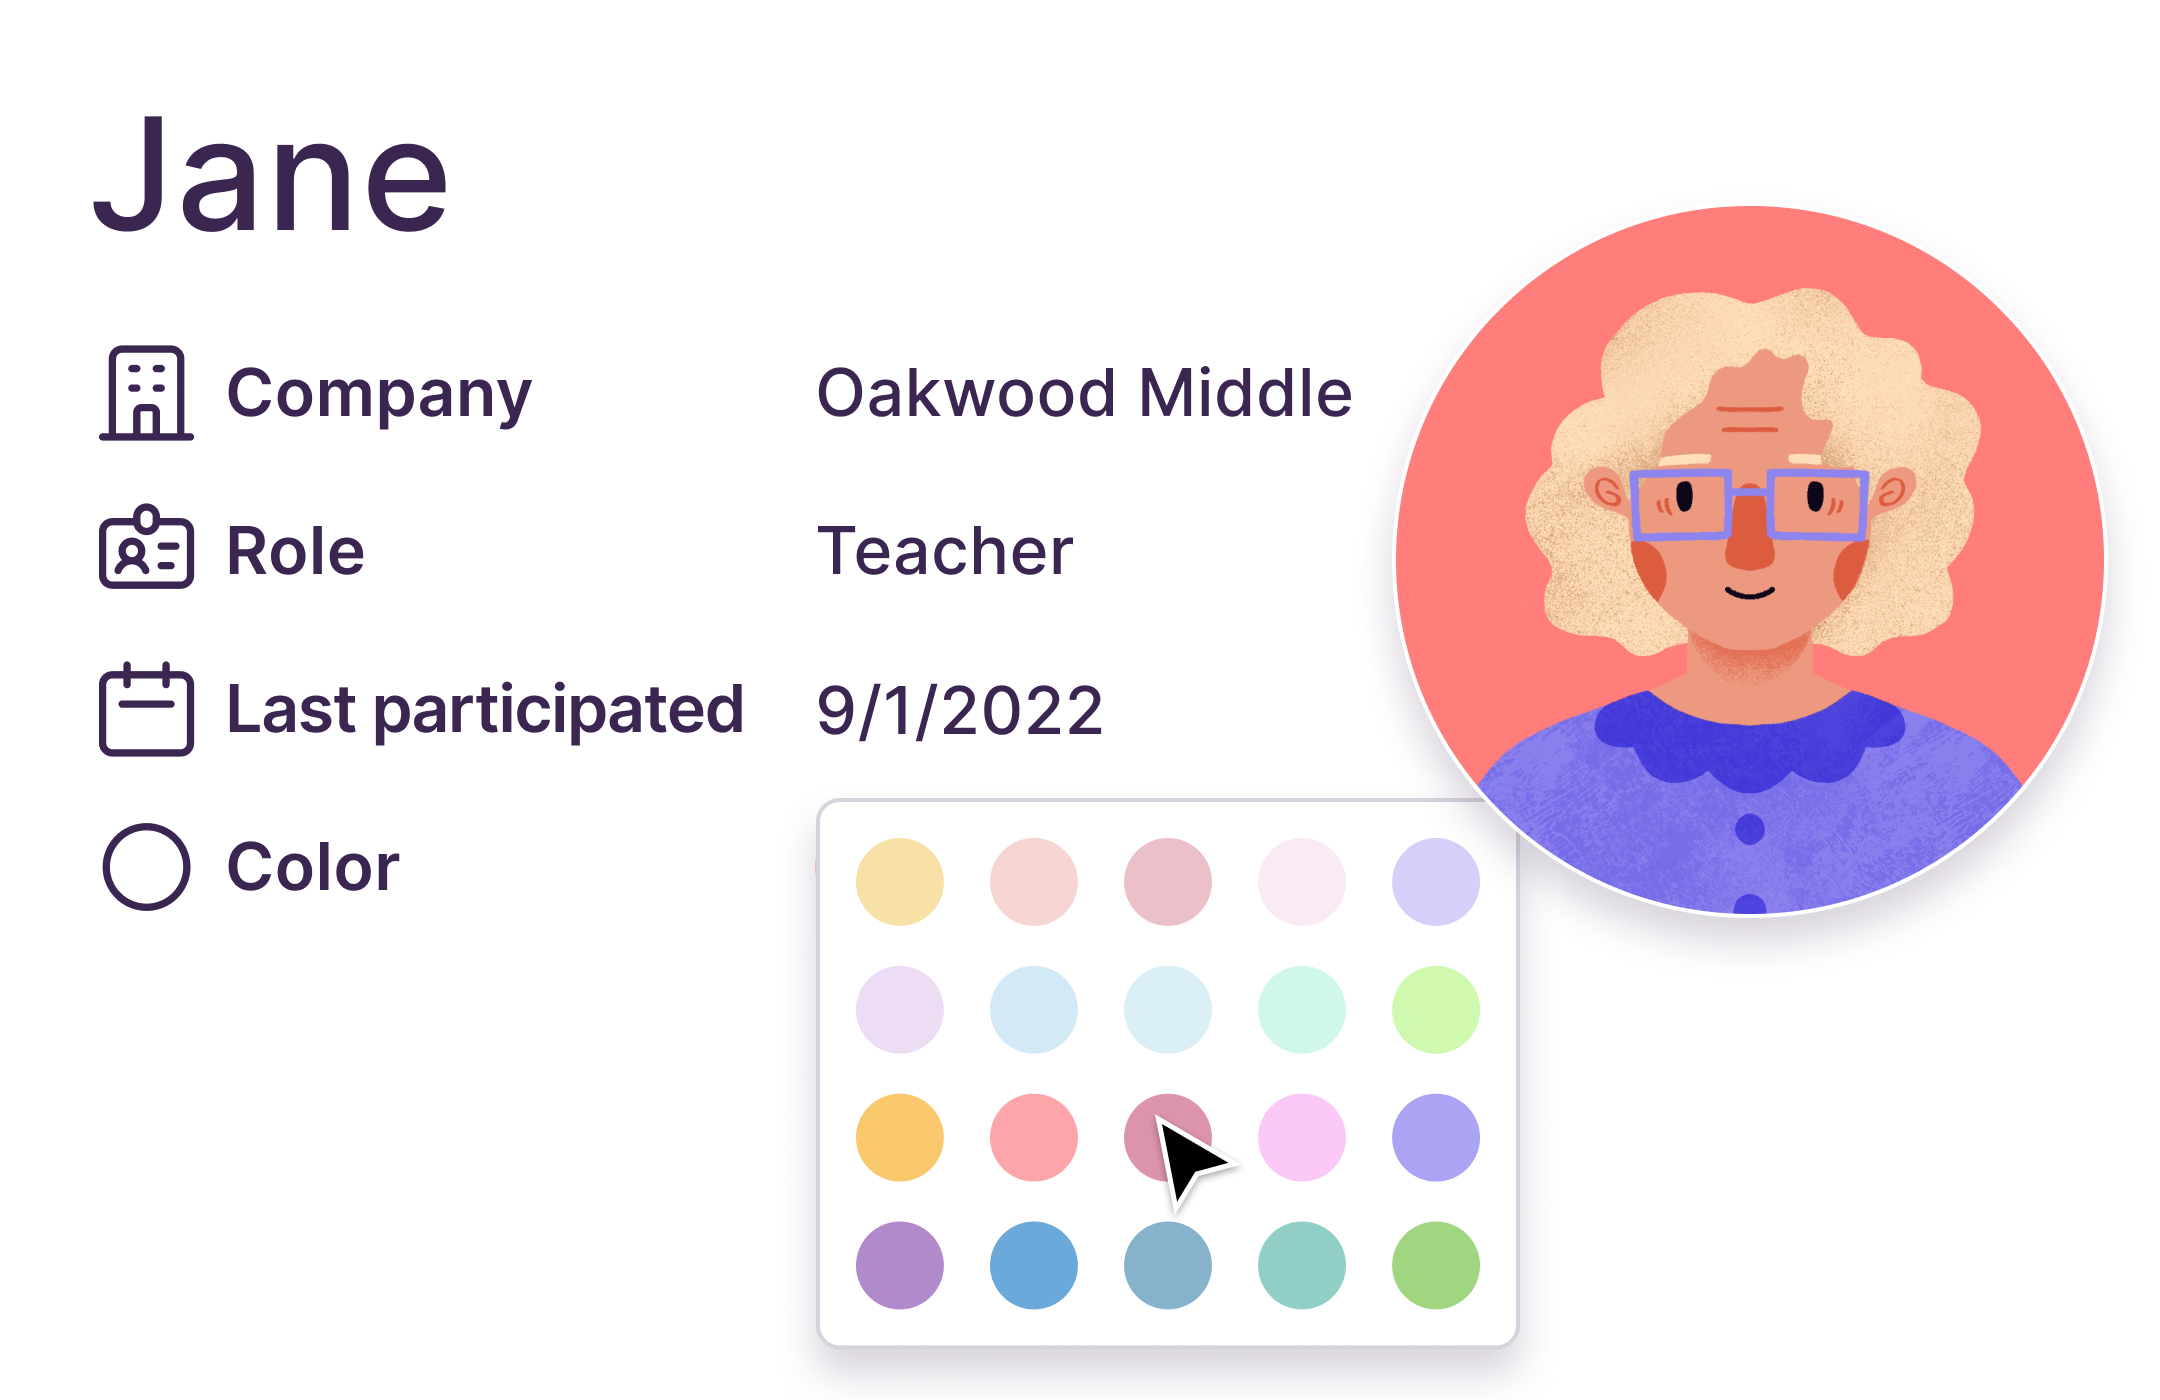
Every participant now has their own unique color value, and you can recolor the analysis board by “All Participants” or by one specific participant. This gives you an instant lens to visualize how people in your study are distributed across themes.
No more manually changing the color of sticky notes.
Load More
→